Yup'ik vs Immigrants from Nigeria 10th Grade
COMPARE
Yup'ik
Immigrants from Nigeria
10th Grade
10th Grade Comparison
Yup'ik
Immigrants from Nigeria
93.6%
10TH GRADE
31.1/ 100
METRIC RATING
191st/ 347
METRIC RANK
92.7%
10TH GRADE
0.7/ 100
METRIC RATING
256th/ 347
METRIC RANK
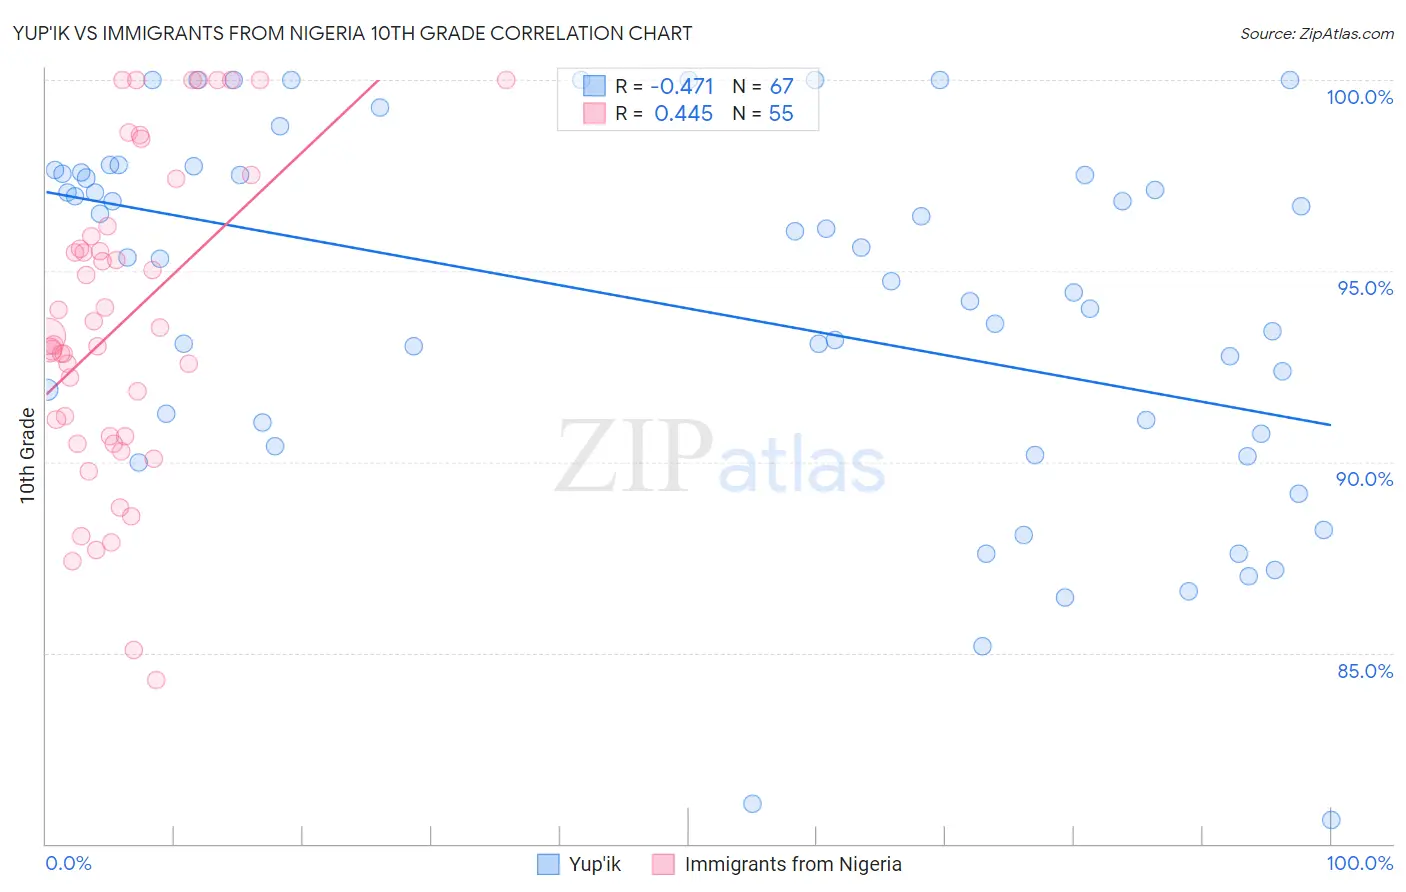
Yup'ik vs Immigrants from Nigeria 10th Grade Correlation Chart
The statistical analysis conducted on geographies consisting of 39,963,824 people shows a moderate negative correlation between the proportion of Yup'ik and percentage of population with at least 10th grade education in the United States with a correlation coefficient (R) of -0.471 and weighted average of 93.6%. Similarly, the statistical analysis conducted on geographies consisting of 283,441,873 people shows a moderate positive correlation between the proportion of Immigrants from Nigeria and percentage of population with at least 10th grade education in the United States with a correlation coefficient (R) of 0.445 and weighted average of 92.7%, a difference of 0.95%.
10th Grade Correlation Summary
| Measurement | Yup'ik | Immigrants from Nigeria |
| Minimum | 80.6% | 84.3% |
| Maximum | 100.0% | 100.0% |
| Range | 19.4% | 15.7% |
| Mean | 94.0% | 93.7% |
| Median | 95.3% | 93.3% |
| Interquartile 25% (IQ1) | 90.7% | 90.7% |
| Interquartile 75% (IQ3) | 97.6% | 96.2% |
| Interquartile Range (IQR) | 6.8% | 5.5% |
| Standard Deviation (Sample) | 4.8% | 4.1% |
| Standard Deviation (Population) | 4.7% | 4.1% |
Similar Demographics by 10th Grade
Demographics Similar to Yup'ik by 10th Grade
In terms of 10th grade, the demographic groups most similar to Yup'ik are Laotian (93.6%, a difference of 0.010%), Marshallese (93.6%, a difference of 0.020%), Immigrants from Pakistan (93.6%, a difference of 0.020%), Immigrants from Malaysia (93.5%, a difference of 0.030%), and Panamanian (93.5%, a difference of 0.030%).
| Demographics | Rating | Rank | 10th Grade |
| Choctaw | 36.6 /100 | #184 | Fair 93.6% |
| Sudanese | 36.6 /100 | #185 | Fair 93.6% |
| Immigrants | Eastern Asia | 35.1 /100 | #186 | Fair 93.6% |
| Liberians | 34.7 /100 | #187 | Fair 93.6% |
| Marshallese | 33.2 /100 | #188 | Fair 93.6% |
| Immigrants | Pakistan | 32.5 /100 | #189 | Fair 93.6% |
| Laotians | 32.1 /100 | #190 | Fair 93.6% |
| Yup'ik | 31.1 /100 | #191 | Fair 93.6% |
| Immigrants | Malaysia | 28.0 /100 | #192 | Fair 93.5% |
| Panamanians | 28.0 /100 | #193 | Fair 93.5% |
| Immigrants | Morocco | 26.9 /100 | #194 | Fair 93.5% |
| Cheyenne | 26.8 /100 | #195 | Fair 93.5% |
| Moroccans | 25.3 /100 | #196 | Fair 93.5% |
| Pueblo | 23.9 /100 | #197 | Fair 93.5% |
| Immigrants | Micronesia | 23.2 /100 | #198 | Fair 93.5% |
Demographics Similar to Immigrants from Nigeria by 10th Grade
In terms of 10th grade, the demographic groups most similar to Immigrants from Nigeria are Immigrants from Bolivia (92.7%, a difference of 0.010%), U.S. Virgin Islander (92.7%, a difference of 0.010%), Immigrants from Costa Rica (92.7%, a difference of 0.020%), Armenian (92.7%, a difference of 0.060%), and Immigrants from Jamaica (92.6%, a difference of 0.060%).
| Demographics | Rating | Rank | 10th Grade |
| Immigrants | Senegal | 1.4 /100 | #249 | Tragic 92.8% |
| Jamaicans | 1.2 /100 | #250 | Tragic 92.8% |
| Immigrants | Thailand | 1.0 /100 | #251 | Tragic 92.8% |
| South Americans | 0.9 /100 | #252 | Tragic 92.8% |
| Ghanaians | 0.9 /100 | #253 | Tragic 92.8% |
| Armenians | 0.9 /100 | #254 | Tragic 92.7% |
| Immigrants | Bolivia | 0.7 /100 | #255 | Tragic 92.7% |
| Immigrants | Nigeria | 0.7 /100 | #256 | Tragic 92.7% |
| U.S. Virgin Islanders | 0.7 /100 | #257 | Tragic 92.7% |
| Immigrants | Costa Rica | 0.6 /100 | #258 | Tragic 92.7% |
| Immigrants | Jamaica | 0.5 /100 | #259 | Tragic 92.6% |
| Immigrants | Uzbekistan | 0.5 /100 | #260 | Tragic 92.6% |
| Paiute | 0.4 /100 | #261 | Tragic 92.6% |
| Immigrants | South America | 0.4 /100 | #262 | Tragic 92.6% |
| Apache | 0.4 /100 | #263 | Tragic 92.6% |