Yup'ik vs White/Caucasian 10th Grade
COMPARE
Yup'ik
White/Caucasian
10th Grade
10th Grade Comparison
Yup'ik
Whites/Caucasians
93.6%
10TH GRADE
31.1/ 100
METRIC RATING
191st/ 347
METRIC RANK
94.7%
10TH GRADE
98.8/ 100
METRIC RATING
91st/ 347
METRIC RANK
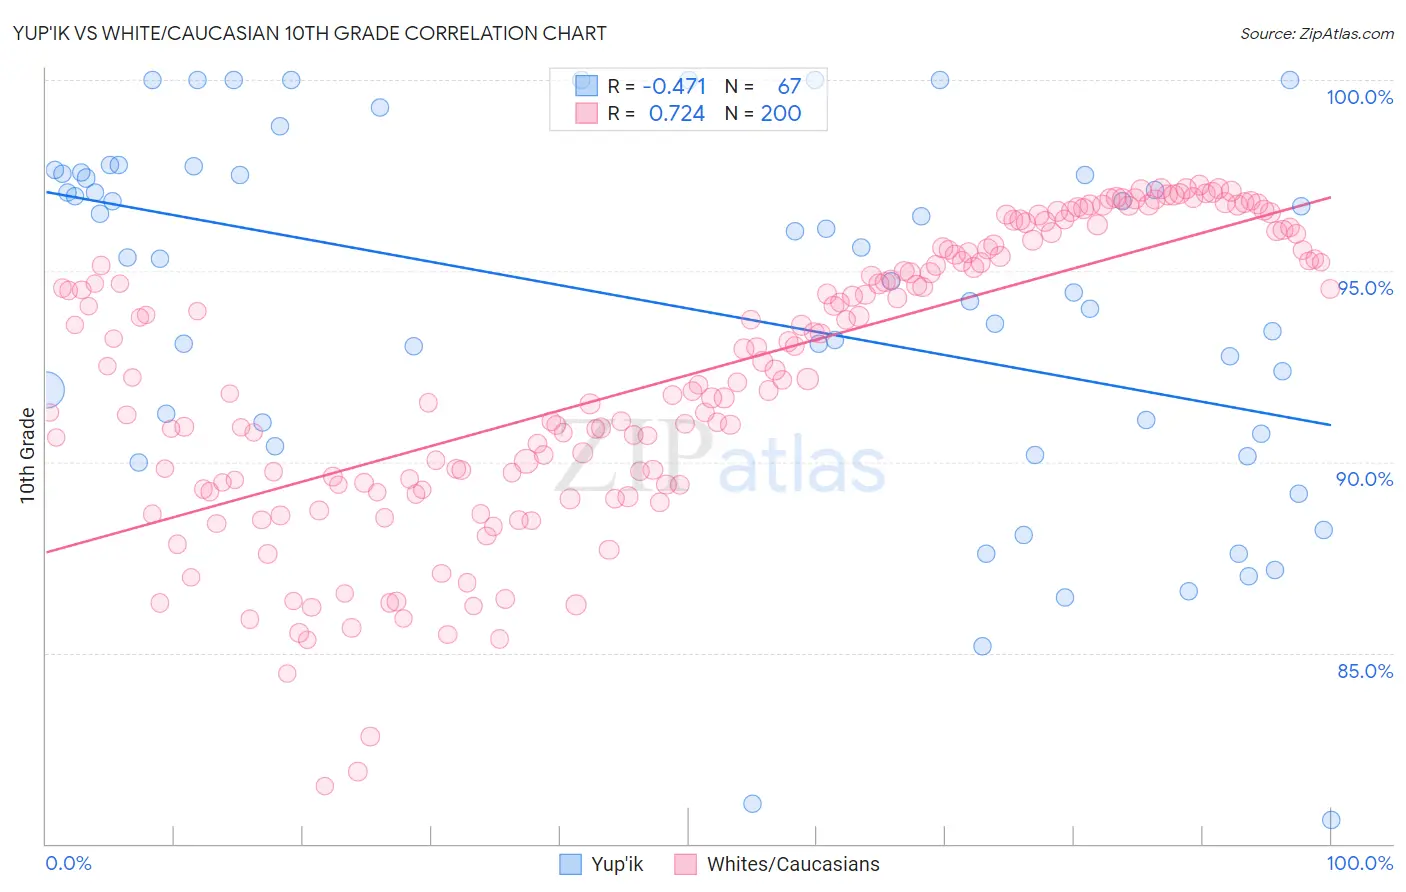
Yup'ik vs White/Caucasian 10th Grade Correlation Chart
The statistical analysis conducted on geographies consisting of 39,963,824 people shows a moderate negative correlation between the proportion of Yup'ik and percentage of population with at least 10th grade education in the United States with a correlation coefficient (R) of -0.471 and weighted average of 93.6%. Similarly, the statistical analysis conducted on geographies consisting of 585,244,993 people shows a strong positive correlation between the proportion of Whites/Caucasians and percentage of population with at least 10th grade education in the United States with a correlation coefficient (R) of 0.724 and weighted average of 94.7%, a difference of 1.2%.
10th Grade Correlation Summary
| Measurement | Yup'ik | White/Caucasian |
| Minimum | 80.6% | 81.5% |
| Maximum | 100.0% | 97.2% |
| Range | 19.4% | 15.7% |
| Mean | 94.0% | 92.3% |
| Median | 95.3% | 92.6% |
| Interquartile 25% (IQ1) | 90.7% | 89.5% |
| Interquartile 75% (IQ3) | 97.6% | 95.5% |
| Interquartile Range (IQR) | 6.8% | 6.1% |
| Standard Deviation (Sample) | 4.8% | 3.7% |
| Standard Deviation (Population) | 4.7% | 3.7% |
Similar Demographics by 10th Grade
Demographics Similar to Yup'ik by 10th Grade
In terms of 10th grade, the demographic groups most similar to Yup'ik are Laotian (93.6%, a difference of 0.010%), Marshallese (93.6%, a difference of 0.020%), Immigrants from Pakistan (93.6%, a difference of 0.020%), Immigrants from Malaysia (93.5%, a difference of 0.030%), and Panamanian (93.5%, a difference of 0.030%).
| Demographics | Rating | Rank | 10th Grade |
| Choctaw | 36.6 /100 | #184 | Fair 93.6% |
| Sudanese | 36.6 /100 | #185 | Fair 93.6% |
| Immigrants | Eastern Asia | 35.1 /100 | #186 | Fair 93.6% |
| Liberians | 34.7 /100 | #187 | Fair 93.6% |
| Marshallese | 33.2 /100 | #188 | Fair 93.6% |
| Immigrants | Pakistan | 32.5 /100 | #189 | Fair 93.6% |
| Laotians | 32.1 /100 | #190 | Fair 93.6% |
| Yup'ik | 31.1 /100 | #191 | Fair 93.6% |
| Immigrants | Malaysia | 28.0 /100 | #192 | Fair 93.5% |
| Panamanians | 28.0 /100 | #193 | Fair 93.5% |
| Immigrants | Morocco | 26.9 /100 | #194 | Fair 93.5% |
| Cheyenne | 26.8 /100 | #195 | Fair 93.5% |
| Moroccans | 25.3 /100 | #196 | Fair 93.5% |
| Pueblo | 23.9 /100 | #197 | Fair 93.5% |
| Immigrants | Micronesia | 23.2 /100 | #198 | Fair 93.5% |
Demographics Similar to Whites/Caucasians by 10th Grade
In terms of 10th grade, the demographic groups most similar to Whites/Caucasians are South African (94.7%, a difference of 0.010%), Immigrants from Moldova (94.7%, a difference of 0.020%), Immigrants from Japan (94.7%, a difference of 0.030%), Immigrants from Saudi Arabia (94.7%, a difference of 0.040%), and Icelander (94.7%, a difference of 0.050%).
| Demographics | Rating | Rank | 10th Grade |
| Icelanders | 99.1 /100 | #84 | Exceptional 94.7% |
| Crow | 99.0 /100 | #85 | Exceptional 94.7% |
| Puget Sound Salish | 99.0 /100 | #86 | Exceptional 94.7% |
| Immigrants | Saudi Arabia | 99.0 /100 | #87 | Exceptional 94.7% |
| Immigrants | Japan | 99.0 /100 | #88 | Exceptional 94.7% |
| Immigrants | Moldova | 98.9 /100 | #89 | Exceptional 94.7% |
| South Africans | 98.8 /100 | #90 | Exceptional 94.7% |
| Whites/Caucasians | 98.8 /100 | #91 | Exceptional 94.7% |
| Yugoslavians | 98.4 /100 | #92 | Exceptional 94.6% |
| Soviet Union | 98.3 /100 | #93 | Exceptional 94.6% |
| Immigrants | Germany | 98.3 /100 | #94 | Exceptional 94.6% |
| Menominee | 98.3 /100 | #95 | Exceptional 94.6% |
| Immigrants | Switzerland | 98.3 /100 | #96 | Exceptional 94.6% |
| Lebanese | 98.3 /100 | #97 | Exceptional 94.6% |
| Immigrants | Bulgaria | 98.1 /100 | #98 | Exceptional 94.6% |