Lithuanian vs Yaqui 10th Grade
COMPARE
Lithuanian
Yaqui
10th Grade
10th Grade Comparison
Lithuanians
Yaqui
95.8%
10TH GRADE
100.0/ 100
METRIC RATING
8th/ 347
METRIC RANK
91.1%
10TH GRADE
0.0/ 100
METRIC RATING
306th/ 347
METRIC RANK
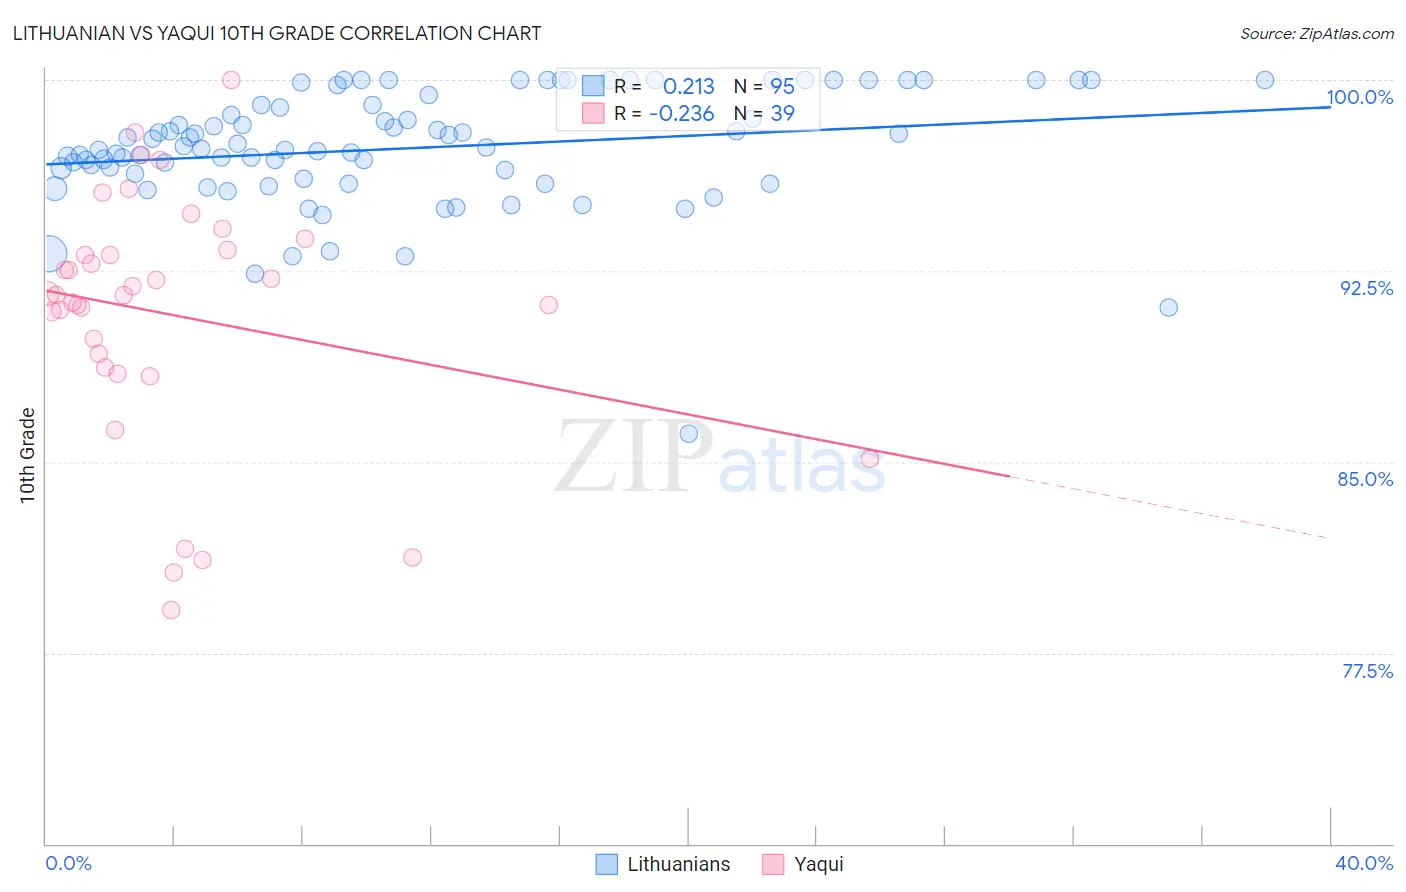
Lithuanian vs Yaqui 10th Grade Correlation Chart
The statistical analysis conducted on geographies consisting of 421,947,524 people shows a weak positive correlation between the proportion of Lithuanians and percentage of population with at least 10th grade education in the United States with a correlation coefficient (R) of 0.213 and weighted average of 95.8%. Similarly, the statistical analysis conducted on geographies consisting of 107,725,021 people shows a weak negative correlation between the proportion of Yaqui and percentage of population with at least 10th grade education in the United States with a correlation coefficient (R) of -0.236 and weighted average of 91.1%, a difference of 5.2%.
10th Grade Correlation Summary
| Measurement | Lithuanian | Yaqui |
| Minimum | 86.1% | 79.2% |
| Maximum | 100.0% | 100.0% |
| Range | 13.9% | 20.8% |
| Mean | 97.3% | 90.8% |
| Median | 97.4% | 91.6% |
| Interquartile 25% (IQ1) | 96.1% | 88.7% |
| Interquartile 75% (IQ3) | 99.0% | 93.3% |
| Interquartile Range (IQR) | 2.9% | 4.7% |
| Standard Deviation (Sample) | 2.3% | 4.9% |
| Standard Deviation (Population) | 2.3% | 4.8% |
Similar Demographics by 10th Grade
Demographics Similar to Lithuanians by 10th Grade
In terms of 10th grade, the demographic groups most similar to Lithuanians are German (95.8%, a difference of 0.010%), Polish (95.8%, a difference of 0.030%), Finnish (95.8%, a difference of 0.060%), Croatian (95.7%, a difference of 0.080%), and Danish (95.7%, a difference of 0.11%).
| Demographics | Rating | Rank | 10th Grade |
| Norwegians | 100.0 /100 | #1 | Exceptional 96.2% |
| Slovaks | 100.0 /100 | #2 | Exceptional 96.0% |
| Slovenes | 100.0 /100 | #3 | Exceptional 95.9% |
| Swedes | 100.0 /100 | #4 | Exceptional 95.9% |
| Carpatho Rusyns | 100.0 /100 | #5 | Exceptional 95.9% |
| Poles | 100.0 /100 | #6 | Exceptional 95.8% |
| Germans | 100.0 /100 | #7 | Exceptional 95.8% |
| Lithuanians | 100.0 /100 | #8 | Exceptional 95.8% |
| Finns | 100.0 /100 | #9 | Exceptional 95.8% |
| Croatians | 100.0 /100 | #10 | Exceptional 95.7% |
| Danes | 100.0 /100 | #11 | Exceptional 95.7% |
| Tlingit-Haida | 100.0 /100 | #12 | Exceptional 95.7% |
| English | 100.0 /100 | #13 | Exceptional 95.6% |
| Tsimshian | 100.0 /100 | #14 | Exceptional 95.6% |
| Irish | 100.0 /100 | #15 | Exceptional 95.6% |
Demographics Similar to Yaqui by 10th Grade
In terms of 10th grade, the demographic groups most similar to Yaqui are Immigrants from Dominica (91.1%, a difference of 0.060%), Immigrants from Fiji (91.0%, a difference of 0.060%), Immigrants from Bangladesh (91.0%, a difference of 0.070%), Pima (91.2%, a difference of 0.080%), and Immigrants (91.0%, a difference of 0.11%).
| Demographics | Rating | Rank | 10th Grade |
| Immigrants | Haiti | 0.0 /100 | #299 | Tragic 91.4% |
| Guyanese | 0.0 /100 | #300 | Tragic 91.4% |
| Japanese | 0.0 /100 | #301 | Tragic 91.2% |
| Immigrants | Guyana | 0.0 /100 | #302 | Tragic 91.2% |
| Immigrants | Vietnam | 0.0 /100 | #303 | Tragic 91.2% |
| Pima | 0.0 /100 | #304 | Tragic 91.2% |
| Immigrants | Dominica | 0.0 /100 | #305 | Tragic 91.1% |
| Yaqui | 0.0 /100 | #306 | Tragic 91.1% |
| Immigrants | Fiji | 0.0 /100 | #307 | Tragic 91.0% |
| Immigrants | Bangladesh | 0.0 /100 | #308 | Tragic 91.0% |
| Immigrants | Immigrants | 0.0 /100 | #309 | Tragic 91.0% |
| Vietnamese | 0.0 /100 | #310 | Tragic 90.9% |
| Immigrants | Cambodia | 0.0 /100 | #311 | Tragic 90.9% |
| Immigrants | Portugal | 0.0 /100 | #312 | Tragic 90.8% |
| Cape Verdeans | 0.0 /100 | #313 | Tragic 90.8% |