Yuman vs Albanian 10th Grade
COMPARE
Yuman
Albanian
10th Grade
10th Grade Comparison
Yuman
Albanians
92.0%
10TH GRADE
0.0/ 100
METRIC RATING
286th/ 347
METRIC RANK
94.1%
10TH GRADE
86.5/ 100
METRIC RATING
142nd/ 347
METRIC RANK
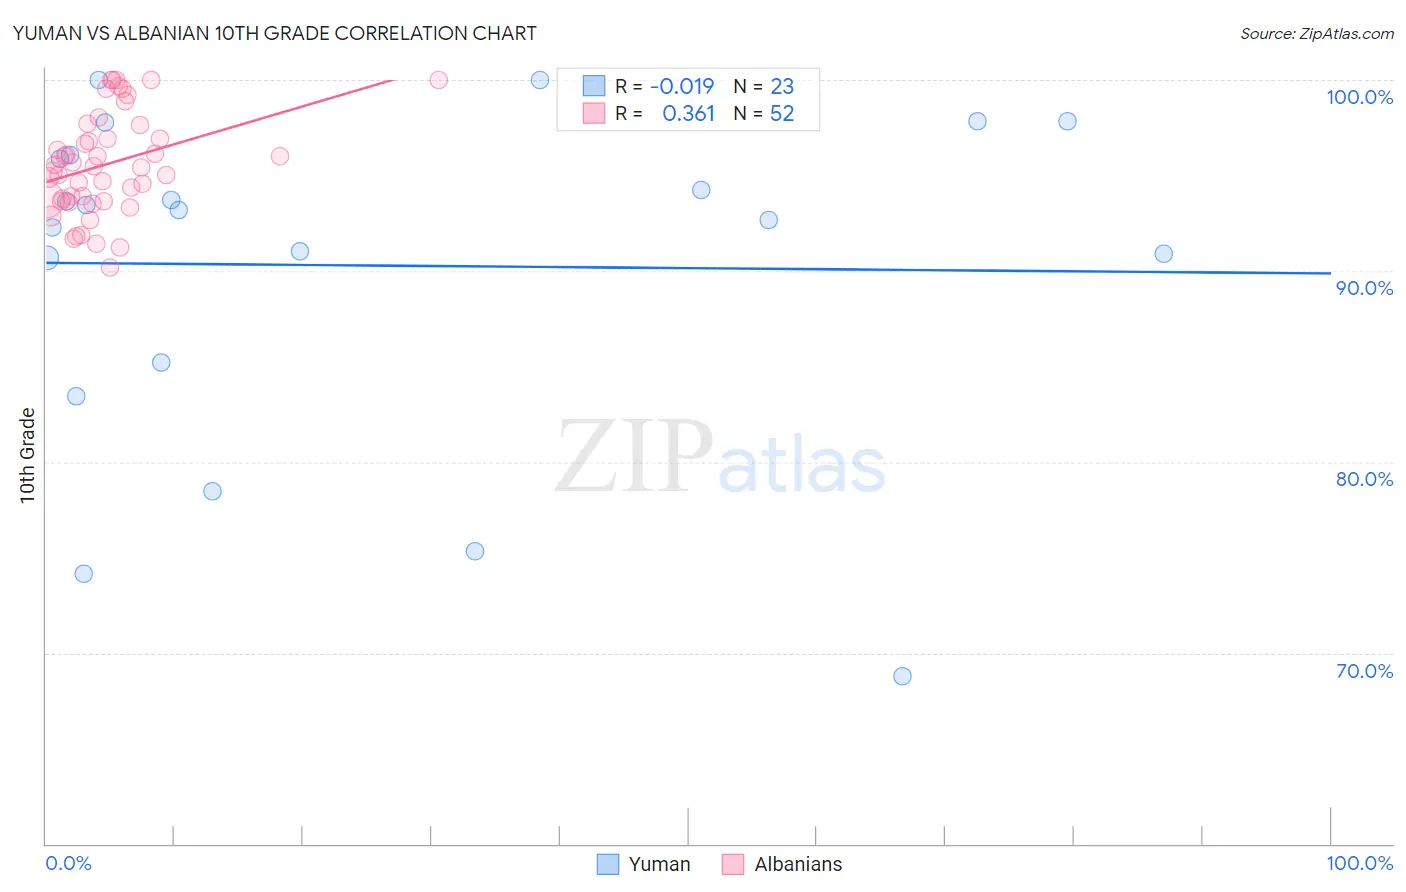
Yuman vs Albanian 10th Grade Correlation Chart
The statistical analysis conducted on geographies consisting of 40,696,349 people shows no correlation between the proportion of Yuman and percentage of population with at least 10th grade education in the United States with a correlation coefficient (R) of -0.019 and weighted average of 92.0%. Similarly, the statistical analysis conducted on geographies consisting of 193,265,850 people shows a mild positive correlation between the proportion of Albanians and percentage of population with at least 10th grade education in the United States with a correlation coefficient (R) of 0.361 and weighted average of 94.1%, a difference of 2.3%.
10th Grade Correlation Summary
| Measurement | Yuman | Albanian |
| Minimum | 68.8% | 90.1% |
| Maximum | 100.0% | 100.0% |
| Range | 31.2% | 9.9% |
| Mean | 90.3% | 95.6% |
| Median | 93.2% | 95.4% |
| Interquartile 25% (IQ1) | 85.2% | 93.7% |
| Interquartile 75% (IQ3) | 96.0% | 97.3% |
| Interquartile Range (IQR) | 10.8% | 3.6% |
| Standard Deviation (Sample) | 8.7% | 2.6% |
| Standard Deviation (Population) | 8.5% | 2.6% |
Similar Demographics by 10th Grade
Demographics Similar to Yuman by 10th Grade
In terms of 10th grade, the demographic groups most similar to Yuman are Immigrants from South Eastern Asia (92.1%, a difference of 0.050%), Immigrants from Barbados (92.1%, a difference of 0.070%), Immigrants from St. Vincent and the Grenadines (92.1%, a difference of 0.090%), Immigrants from Peru (92.2%, a difference of 0.15%), and Pennsylvania German (91.9%, a difference of 0.15%).
| Demographics | Rating | Rank | 10th Grade |
| Natives/Alaskans | 0.1 /100 | #279 | Tragic 92.2% |
| Malaysians | 0.1 /100 | #280 | Tragic 92.2% |
| Bangladeshis | 0.1 /100 | #281 | Tragic 92.2% |
| Immigrants | Peru | 0.1 /100 | #282 | Tragic 92.2% |
| Immigrants | St. Vincent and the Grenadines | 0.0 /100 | #283 | Tragic 92.1% |
| Immigrants | Barbados | 0.0 /100 | #284 | Tragic 92.1% |
| Immigrants | South Eastern Asia | 0.0 /100 | #285 | Tragic 92.1% |
| Yuman | 0.0 /100 | #286 | Tragic 92.0% |
| Pennsylvania Germans | 0.0 /100 | #287 | Tragic 91.9% |
| Immigrants | Laos | 0.0 /100 | #288 | Tragic 91.9% |
| Sri Lankans | 0.0 /100 | #289 | Tragic 91.8% |
| British West Indians | 0.0 /100 | #290 | Tragic 91.8% |
| Immigrants | West Indies | 0.0 /100 | #291 | Tragic 91.8% |
| Immigrants | Burma/Myanmar | 0.0 /100 | #292 | Tragic 91.8% |
| Indonesians | 0.0 /100 | #293 | Tragic 91.8% |
Demographics Similar to Albanians by 10th Grade
In terms of 10th grade, the demographic groups most similar to Albanians are Hmong (94.1%, a difference of 0.0%), Immigrants from Jordan (94.1%, a difference of 0.020%), Cherokee (94.1%, a difference of 0.030%), Immigrants from Kazakhstan (94.1%, a difference of 0.030%), and Nonimmigrants (94.1%, a difference of 0.050%).
| Demographics | Rating | Rank | 10th Grade |
| Immigrants | Korea | 91.3 /100 | #135 | Exceptional 94.2% |
| Shoshone | 90.8 /100 | #136 | Exceptional 94.2% |
| Arapaho | 90.5 /100 | #137 | Exceptional 94.2% |
| Immigrants | Sri Lanka | 89.9 /100 | #138 | Excellent 94.2% |
| Immigrants | Bosnia and Herzegovina | 89.4 /100 | #139 | Excellent 94.2% |
| Immigrants | Jordan | 87.6 /100 | #140 | Excellent 94.1% |
| Hmong | 86.6 /100 | #141 | Excellent 94.1% |
| Albanians | 86.5 /100 | #142 | Excellent 94.1% |
| Cherokee | 84.9 /100 | #143 | Excellent 94.1% |
| Immigrants | Kazakhstan | 84.9 /100 | #144 | Excellent 94.1% |
| Immigrants | Nonimmigrants | 83.8 /100 | #145 | Excellent 94.1% |
| Chickasaw | 82.6 /100 | #146 | Excellent 94.1% |
| Immigrants | Ukraine | 81.5 /100 | #147 | Excellent 94.0% |
| Arabs | 80.9 /100 | #148 | Excellent 94.0% |
| Ugandans | 80.7 /100 | #149 | Excellent 94.0% |