Yuman vs Immigrants from Cuba 10th Grade
COMPARE
Yuman
Immigrants from Cuba
10th Grade
10th Grade Comparison
Yuman
Immigrants from Cuba
92.0%
10TH GRADE
0.0/ 100
METRIC RATING
286th/ 347
METRIC RANK
90.2%
10TH GRADE
0.0/ 100
METRIC RATING
318th/ 347
METRIC RANK
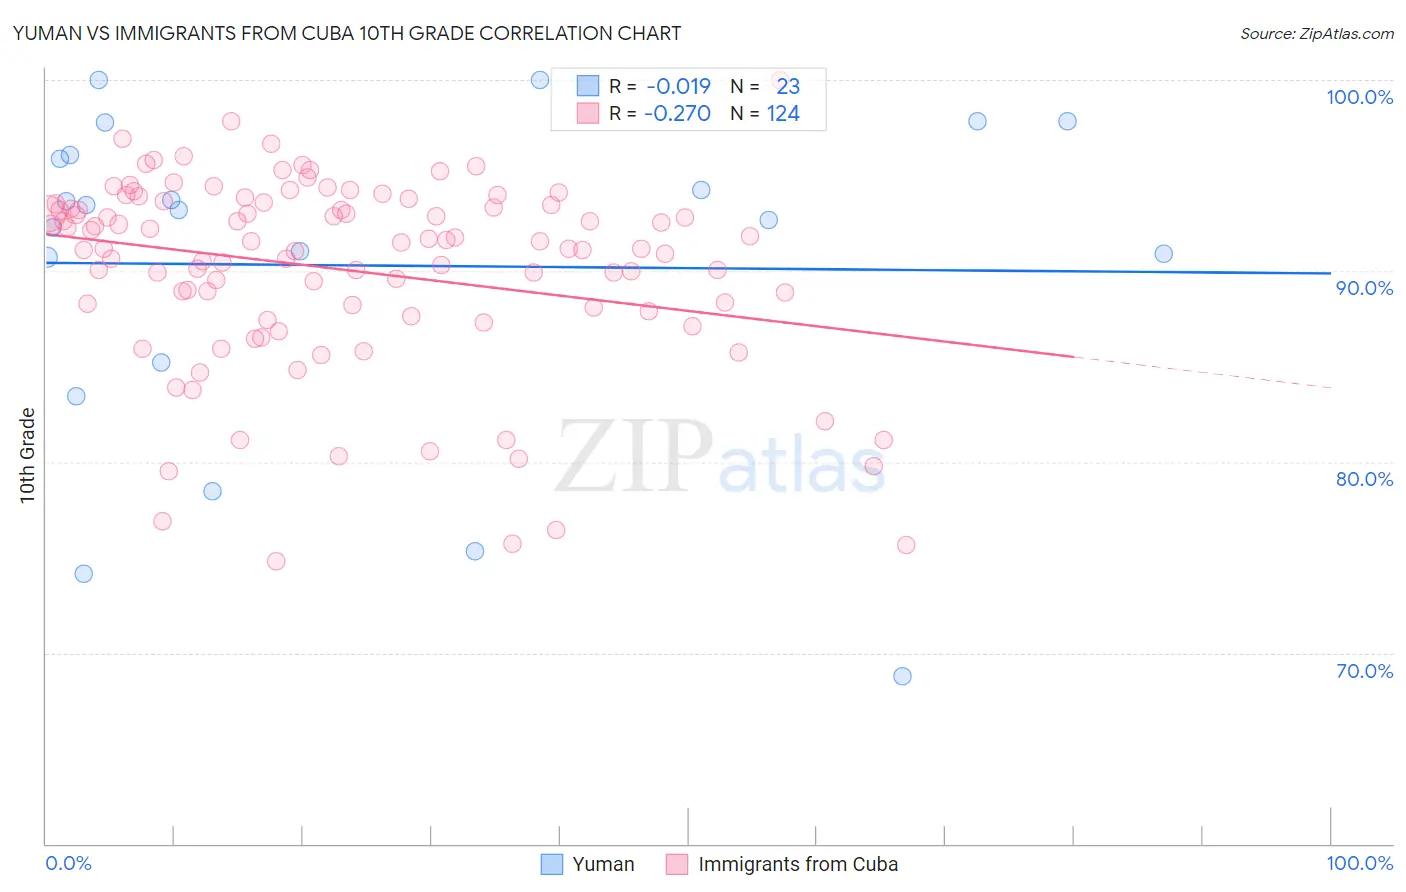
Yuman vs Immigrants from Cuba 10th Grade Correlation Chart
The statistical analysis conducted on geographies consisting of 40,696,349 people shows no correlation between the proportion of Yuman and percentage of population with at least 10th grade education in the United States with a correlation coefficient (R) of -0.019 and weighted average of 92.0%. Similarly, the statistical analysis conducted on geographies consisting of 326,019,170 people shows a weak negative correlation between the proportion of Immigrants from Cuba and percentage of population with at least 10th grade education in the United States with a correlation coefficient (R) of -0.270 and weighted average of 90.2%, a difference of 2.0%.
10th Grade Correlation Summary
| Measurement | Yuman | Immigrants from Cuba |
| Minimum | 68.8% | 74.8% |
| Maximum | 100.0% | 100.0% |
| Range | 31.2% | 25.2% |
| Mean | 90.3% | 90.1% |
| Median | 93.2% | 91.3% |
| Interquartile 25% (IQ1) | 85.2% | 88.0% |
| Interquartile 75% (IQ3) | 96.0% | 93.5% |
| Interquartile Range (IQR) | 10.8% | 5.5% |
| Standard Deviation (Sample) | 8.7% | 5.0% |
| Standard Deviation (Population) | 8.5% | 5.0% |
Similar Demographics by 10th Grade
Demographics Similar to Yuman by 10th Grade
In terms of 10th grade, the demographic groups most similar to Yuman are Immigrants from South Eastern Asia (92.1%, a difference of 0.050%), Immigrants from Barbados (92.1%, a difference of 0.070%), Immigrants from St. Vincent and the Grenadines (92.1%, a difference of 0.090%), Immigrants from Peru (92.2%, a difference of 0.15%), and Pennsylvania German (91.9%, a difference of 0.15%).
| Demographics | Rating | Rank | 10th Grade |
| Natives/Alaskans | 0.1 /100 | #279 | Tragic 92.2% |
| Malaysians | 0.1 /100 | #280 | Tragic 92.2% |
| Bangladeshis | 0.1 /100 | #281 | Tragic 92.2% |
| Immigrants | Peru | 0.1 /100 | #282 | Tragic 92.2% |
| Immigrants | St. Vincent and the Grenadines | 0.0 /100 | #283 | Tragic 92.1% |
| Immigrants | Barbados | 0.0 /100 | #284 | Tragic 92.1% |
| Immigrants | South Eastern Asia | 0.0 /100 | #285 | Tragic 92.1% |
| Yuman | 0.0 /100 | #286 | Tragic 92.0% |
| Pennsylvania Germans | 0.0 /100 | #287 | Tragic 91.9% |
| Immigrants | Laos | 0.0 /100 | #288 | Tragic 91.9% |
| Sri Lankans | 0.0 /100 | #289 | Tragic 91.8% |
| British West Indians | 0.0 /100 | #290 | Tragic 91.8% |
| Immigrants | West Indies | 0.0 /100 | #291 | Tragic 91.8% |
| Immigrants | Burma/Myanmar | 0.0 /100 | #292 | Tragic 91.8% |
| Indonesians | 0.0 /100 | #293 | Tragic 91.8% |
Demographics Similar to Immigrants from Cuba by 10th Grade
In terms of 10th grade, the demographic groups most similar to Immigrants from Cuba are Nicaraguan (90.2%, a difference of 0.080%), Houma (90.2%, a difference of 0.090%), Belizean (90.2%, a difference of 0.090%), Tohono O'odham (90.1%, a difference of 0.10%), and Immigrants from Belize (90.1%, a difference of 0.19%).
| Demographics | Rating | Rank | 10th Grade |
| Immigrants | Cambodia | 0.0 /100 | #311 | Tragic 90.9% |
| Immigrants | Portugal | 0.0 /100 | #312 | Tragic 90.8% |
| Cape Verdeans | 0.0 /100 | #313 | Tragic 90.8% |
| Nepalese | 0.0 /100 | #314 | Tragic 90.7% |
| Immigrants | Caribbean | 0.0 /100 | #315 | Tragic 90.6% |
| Ecuadorians | 0.0 /100 | #316 | Tragic 90.6% |
| Immigrants | Ecuador | 0.0 /100 | #317 | Tragic 90.4% |
| Immigrants | Cuba | 0.0 /100 | #318 | Tragic 90.2% |
| Nicaraguans | 0.0 /100 | #319 | Tragic 90.2% |
| Houma | 0.0 /100 | #320 | Tragic 90.2% |
| Belizeans | 0.0 /100 | #321 | Tragic 90.2% |
| Tohono O'odham | 0.0 /100 | #322 | Tragic 90.1% |
| Immigrants | Belize | 0.0 /100 | #323 | Tragic 90.1% |
| Immigrants | Armenia | 0.0 /100 | #324 | Tragic 89.9% |
| Puerto Ricans | 0.0 /100 | #325 | Tragic 89.8% |