Cherokee vs Vietnamese High School Diploma

COMPARE

Cherokee
Race
Ancestry
AfghanAfricanAlaska NativeAlaskan AthabascanAlbanianAleutAlsatianAmericanApacheArabArapahoArgentineanArmenianAssyrian/Chaldean/SyriacAustralianAustrianBahamianBangladeshiBarbadianBasqueBelgianBelizeanBermudanBhutaneseBlackfeetBolivianBrazilianBritishBritish West IndianBulgarianBurmeseCajunCambodianCanadianCape VerdeanCarpatho RusynCelticCentral AmericanCentral American IndianCherokeeCheyenneChickasawChileanChineseChippewaChoctawColombianColvilleComancheCosta RicanCreeCreekCroatianCrowCubanCypriotCzechCzechoslovakianDanishDelawareDominicanDutchDutch West IndianEastern EuropeanEcuadorianEgyptianEnglishEstonianEthiopianEuropeanFijianFilipinoFinnishFrenchFrench American IndianFrench CanadianGermanGerman RussianGhanaianGreekGuamanian/ChamorroGuatemalanGuyaneseHaitianHmongHonduranHopiHoumaHungarianIcelanderIndian (Asian)IndonesianInupiatIranianIraqiIrishIroquoisIsraeliItalianJamaicanJapaneseJordanianKenyanKiowaKoreanLaotianLatvianLebaneseLiberianLithuanianLumbeeLuxembourgerMacedonianMalaysianMalteseMarshalleseMenomineeMexicanMexican American IndianMongolianMoroccanNative HawaiianNavajoNepaleseNew ZealanderNicaraguanNigerianNorthern EuropeanNorwegianOkinawanOsageOttawaPaiutePakistaniPalestinianPanamanianParaguayanPennsylvania GermanPeruvianPimaPolishPortuguesePotawatomiPuebloPuerto RicanPuget Sound SalishRomanianRussianSalvadoranSamoanScandinavianScotch-IrishScottishSeminoleSenegaleseSerbianShoshoneSierra LeoneanSiouxSlavicSlovakSloveneSomaliSouth AfricanSouth AmericanSouth American IndianSoviet UnionSpaniardSpanishSpanish AmericanSpanish American IndianSri LankanSubsaharan AfricanSudaneseSwedishSwissSyrianTaiwaneseThaiTlingit-HaidaTohono O'OdhamTonganTrinidadian and TobagonianTsimshianTurkishU.S. Virgin IslanderUgandanUkrainianUruguayanUteVenezuelanWelshWest IndianYakamaYaquiYugoslavianYumanYup'ikZimbabwean
Immigration
NonimmigrantsImmigrantsAfghanistanAfricaAlbaniaArgentinaArmeniaAsiaAustraliaAustriaBahamasBangladeshBarbadosBelarusBelgiumBelizeBoliviaBosnia and HerzegovinaBrazilBulgariaBurma/MyanmarCabo VerdeCambodiaCameroonCanadaCaribbeanCentral AmericaChileChinaColombiaCongoCosta RicaCroatiaCubaCzechoslovakiaDenmarkDominicaDominican RepublicEastern AfricaEastern AsiaEastern EuropeEcuadorEgyptEl SalvadorEnglandEritreaEthiopiaEuropeFijiFranceGermanyGhanaGreeceGrenadaGuatemalaGuyanaHaitiHondurasHong KongHungaryIndiaIndonesiaIranIraqIrelandIsraelItalyJamaicaJapanJordanKazakhstanKenyaKoreaKuwaitLaosLatin AmericaLatviaLebanonLiberiaLithuaniaMalaysiaMexicoMicronesiaMiddle AfricaMoldovaMoroccoNepalNetherlandsNicaraguaNigeriaNorth AmericaNorth MacedoniaNorthern AfricaNorthern EuropeNorwayOceaniaPakistanPanamaPeruPhilippinesPolandPortugalRomaniaRussiaSaudi ArabiaScotlandSenegalSerbiaSierra LeoneSingaporeSomaliaSouth AfricaSouth AmericaSouth Central AsiaSouth Eastern AsiaSouthern EuropeSpainSri LankaSt. Vincent and the GrenadinesSudanSwedenSwitzerlandSyriaTaiwanThailandTrinidad and TobagoTurkeyUgandaUkraineUruguayUzbekistanVenezuelaVietnamWest IndiesWestern AfricaWestern AsiaWestern EuropeYemenZaireZimbabweAzores
Vietnamese
Race
Ancestry
AfghanAfricanAlaska NativeAlaskan AthabascanAlbanianAleutAlsatianAmericanApacheArabArapahoArgentineanArmenianAssyrian/Chaldean/SyriacAustralianAustrianBahamianBangladeshiBarbadianBasqueBelgianBelizeanBermudanBhutaneseBlackfeetBolivianBrazilianBritishBritish West IndianBulgarianBurmeseCajunCambodianCanadianCape VerdeanCarpatho RusynCelticCentral AmericanCentral American IndianCheyenneChickasawChileanChineseChippewaChoctawColombianColvilleComancheCosta RicanCreeCreekCroatianCrowCubanCypriotCzechCzechoslovakianDanishDelawareDominicanDutchDutch West IndianEastern EuropeanEcuadorianEgyptianEnglishEstonianEthiopianEuropeanFijianFilipinoFinnishFrenchFrench American IndianFrench CanadianGermanGerman RussianGhanaianGreekGuamanian/ChamorroGuatemalanGuyaneseHaitianHmongHonduranHopiHoumaHungarianIcelanderIndian (Asian)IndonesianInupiatIranianIraqiIrishIroquoisIsraeliItalianJamaicanJapaneseJordanianKenyanKiowaKoreanLaotianLatvianLebaneseLiberianLithuanianLumbeeLuxembourgerMacedonianMalaysianMalteseMarshalleseMenomineeMexicanMexican American IndianMongolianMoroccanNative HawaiianNavajoNepaleseNew ZealanderNicaraguanNigerianNorthern EuropeanNorwegianOkinawanOsageOttawaPaiutePakistaniPalestinianPanamanianParaguayanPennsylvania GermanPeruvianPimaPolishPortuguesePotawatomiPuebloPuerto RicanPuget Sound SalishRomanianRussianSalvadoranSamoanScandinavianScotch-IrishScottishSeminoleSenegaleseSerbianShoshoneSierra LeoneanSiouxSlavicSlovakSloveneSomaliSouth AfricanSouth AmericanSouth American IndianSoviet UnionSpaniardSpanishSpanish AmericanSpanish American IndianSri LankanSubsaharan AfricanSudaneseSwedishSwissSyrianTaiwaneseThaiTlingit-HaidaTohono O'OdhamTonganTrinidadian and TobagonianTsimshianTurkishU.S. Virgin IslanderUgandanUkrainianUruguayanUteVenezuelanVietnameseWelshWest IndianYakamaYaquiYugoslavianYumanYup'ikZimbabwean
Immigration
NonimmigrantsImmigrantsAfghanistanAfricaAlbaniaArgentinaArmeniaAsiaAustraliaAustriaBahamasBangladeshBarbadosBelarusBelgiumBelizeBoliviaBosnia and HerzegovinaBrazilBulgariaBurma/MyanmarCabo VerdeCambodiaCameroonCanadaCaribbeanCentral AmericaChileChinaColombiaCongoCosta RicaCroatiaCubaCzechoslovakiaDenmarkDominicaDominican RepublicEastern AfricaEastern AsiaEastern EuropeEcuadorEgyptEl SalvadorEnglandEritreaEthiopiaEuropeFijiFranceGermanyGhanaGreeceGrenadaGuatemalaGuyanaHaitiHondurasHong KongHungaryIndiaIndonesiaIranIraqIrelandIsraelItalyJamaicaJapanJordanKazakhstanKenyaKoreaKuwaitLaosLatin AmericaLatviaLebanonLiberiaLithuaniaMalaysiaMexicoMicronesiaMiddle AfricaMoldovaMoroccoNepalNetherlandsNicaraguaNigeriaNorth AmericaNorth MacedoniaNorthern AfricaNorthern EuropeNorwayOceaniaPakistanPanamaPeruPhilippinesPolandPortugalRomaniaRussiaSaudi ArabiaScotlandSenegalSerbiaSierra LeoneSingaporeSomaliaSouth AfricaSouth AmericaSouth Central AsiaSouth Eastern AsiaSouthern EuropeSpainSri LankaSt. Vincent and the GrenadinesSudanSwedenSwitzerlandSyriaTaiwanThailandTrinidad and TobagoTurkeyUgandaUkraineUruguayUzbekistanVenezuelaVietnamWest IndiesWestern AfricaWestern AsiaWestern EuropeYemenZaireZimbabweAzores
High School Diploma
Income
Poverty
Unemployment
Labor Participation
Family Structure
Vehicle Availability
Education Level
Disability

High School Diploma Comparison

Cherokee

Vietnamese

Poor
Tragic
88.5%
HIGH SCHOOL DIPLOMA
14.3/ 100
METRIC RATING
209th/ 347
METRIC RANK
85.4%
HIGH SCHOOL DIPLOMA
0.0/ 100
METRIC RATING
301st/ 347
METRIC RANK

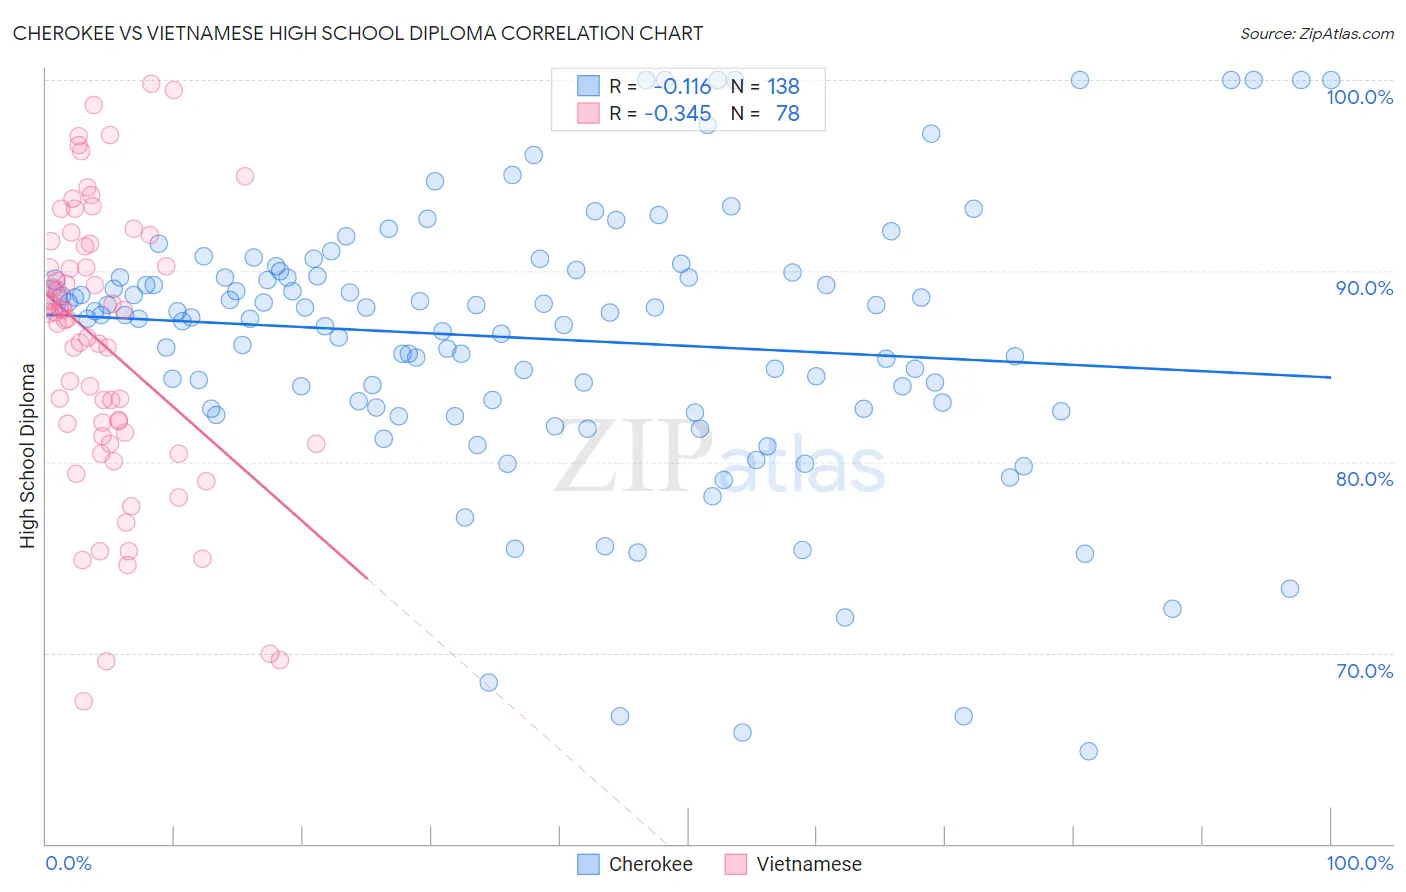
Cherokee vs Vietnamese High School Diploma Correlation Chart

The statistical analysis conducted on geographies consisting of 493,720,047 people shows a poor negative correlation between the proportion of Cherokee and percentage of population with at least high school diploma education in the United States with a correlation coefficient (R) of -0.116 and weighted average of 88.5%. Similarly, the statistical analysis conducted on geographies consisting of 170,753,564 people shows a mild negative correlation between the proportion of Vietnamese and percentage of population with at least high school diploma education in the United States with a correlation coefficient (R) of -0.345 and weighted average of 85.4%, a difference of 3.6%.
Cherokee vs Vietnamese High School Diploma

High School Diploma Correlation Summary

MeasurementCherokeeVietnamese
Minimum64.9%67.5%
Maximum100.0%99.8%
Range35.1%32.3%
Mean86.5%86.1%
Median87.7%87.6%
Interquartile 25% (IQ1)82.9%81.3%
Interquartile 75% (IQ3)89.7%91.3%
Interquartile Range (IQR)6.9%9.9%
Standard Deviation (Sample)7.1%7.3%
Standard Deviation (Population)7.0%7.3%

Similar Demographics by High School Diploma

Demographics Similar to Cherokee by High School Diploma

In terms of high school diploma, the demographic groups most similar to Cherokee are Portuguese (88.5%, a difference of 0.0%), Samoan (88.5%, a difference of 0.010%), Immigrants from Sierra Leone (88.6%, a difference of 0.040%), Inupiat (88.5%, a difference of 0.040%), and Arapaho (88.6%, a difference of 0.050%).
DemographicsRating | RankHigh School Diploma
Panamanians
18.0
/100
|
#202
Poor
88.6%
Somalis
17.5
/100
|
#203
Poor
88.6%
Armenians
17.2
/100
|
#204
Poor
88.6%
Immigrants | Micronesia
16.4
/100
|
#205
Poor
88.6%
Arapaho
16.1
/100
|
#206
Poor
88.6%
Immigrants | Sierra Leone
15.8
/100
|
#207
Poor
88.6%
Portuguese
14.4
/100
|
#208
Poor
88.5%
Cherokee
14.3
/100
|
#209
Poor
88.5%
Samoans
14.0
/100
|
#210
Poor
88.5%
Inupiat
13.1
/100
|
#211
Poor
88.5%
South American Indians
12.2
/100
|
#212
Poor
88.5%
Immigrants | Somalia
11.3
/100
|
#213
Poor
88.4%
Immigrants | Cameroon
10.9
/100
|
#214
Poor
88.4%
Crow
10.9
/100
|
#215
Poor
88.4%
Chickasaw
10.7
/100
|
#216
Poor
88.4%

Demographics Similar to Vietnamese by High School Diploma

In terms of high school diploma, the demographic groups most similar to Vietnamese are Immigrants from Bangladesh (85.5%, a difference of 0.020%), Guyanese (85.5%, a difference of 0.040%), Immigrants from Haiti (85.4%, a difference of 0.040%), Cuban (85.4%, a difference of 0.040%), and Native/Alaskan (85.6%, a difference of 0.14%).
DemographicsRating | RankHigh School Diploma
Immigrants | Fiji
0.0
/100
|
#294
Tragic
85.8%
Immigrants | Immigrants
0.0
/100
|
#295
Tragic
85.8%
Immigrants | Cambodia
0.0
/100
|
#296
Tragic
85.6%
Immigrants | Grenada
0.0
/100
|
#297
Tragic
85.6%
Natives/Alaskans
0.0
/100
|
#298
Tragic
85.6%
Guyanese
0.0
/100
|
#299
Tragic
85.5%
Immigrants | Bangladesh
0.0
/100
|
#300
Tragic
85.5%
Vietnamese
0.0
/100
|
#301
Tragic
85.4%
Immigrants | Haiti
0.0
/100
|
#302
Tragic
85.4%
Cubans
0.0
/100
|
#303
Tragic
85.4%
Nepalese
0.0
/100
|
#304
Tragic
85.3%
Immigrants | Portugal
0.0
/100
|
#305
Tragic
85.3%
Immigrants | Guyana
0.0
/100
|
#306
Tragic
85.3%
Navajo
0.0
/100
|
#307
Tragic
85.2%
Immigrants | Armenia
0.0
/100
|
#308
Tragic
85.2%