Yuman vs Immigrants from Taiwan High School Diploma
COMPARE
Yuman
Immigrants from Taiwan
High School Diploma
High School Diploma Comparison
Yuman
Immigrants from Taiwan
84.0%
HIGH SCHOOL DIPLOMA
0.0/ 100
METRIC RATING
321st/ 347
METRIC RANK
91.0%
HIGH SCHOOL DIPLOMA
99.6/ 100
METRIC RATING
61st/ 347
METRIC RANK
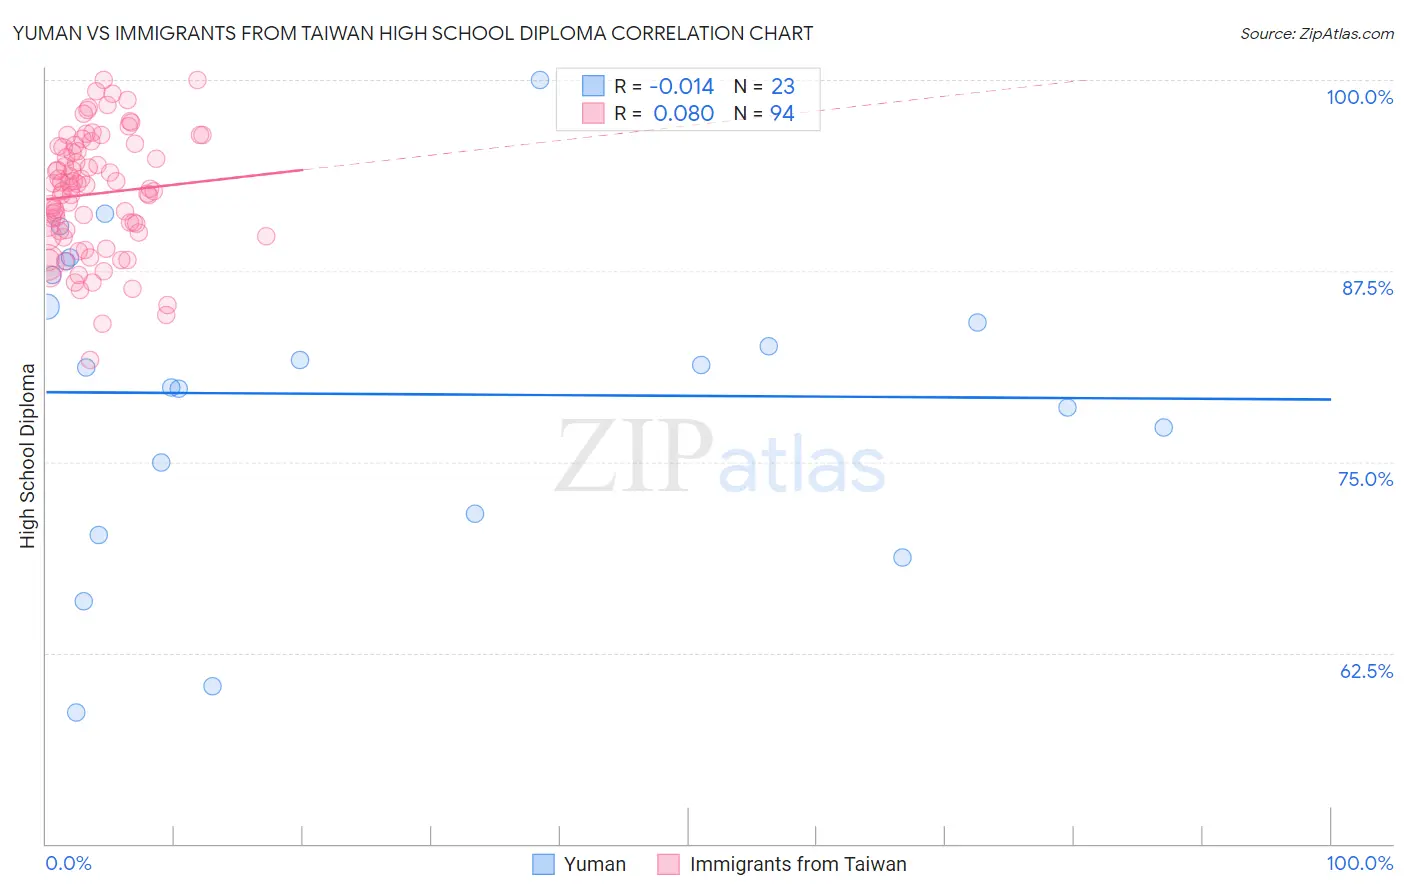
Yuman vs Immigrants from Taiwan High School Diploma Correlation Chart
The statistical analysis conducted on geographies consisting of 40,696,349 people shows no correlation between the proportion of Yuman and percentage of population with at least high school diploma education in the United States with a correlation coefficient (R) of -0.014 and weighted average of 84.0%. Similarly, the statistical analysis conducted on geographies consisting of 298,119,887 people shows a slight positive correlation between the proportion of Immigrants from Taiwan and percentage of population with at least high school diploma education in the United States with a correlation coefficient (R) of 0.080 and weighted average of 91.0%, a difference of 8.4%.
High School Diploma Correlation Summary
| Measurement | Yuman | Immigrants from Taiwan |
| Minimum | 58.6% | 81.7% |
| Maximum | 100.0% | 100.0% |
| Range | 41.4% | 18.3% |
| Mean | 79.4% | 92.5% |
| Median | 81.2% | 92.9% |
| Interquartile 25% (IQ1) | 71.6% | 90.0% |
| Interquartile 75% (IQ3) | 87.2% | 95.6% |
| Interquartile Range (IQR) | 15.6% | 5.6% |
| Standard Deviation (Sample) | 10.1% | 3.9% |
| Standard Deviation (Population) | 9.9% | 3.9% |
Similar Demographics by High School Diploma
Demographics Similar to Yuman by High School Diploma
In terms of high school diploma, the demographic groups most similar to Yuman are Nicaraguan (84.1%, a difference of 0.14%), Central American Indian (84.2%, a difference of 0.24%), Immigrants from Belize (84.2%, a difference of 0.27%), Immigrants from Caribbean (84.3%, a difference of 0.34%), and Belizean (84.3%, a difference of 0.40%).
| Demographics | Rating | Rank | High School Diploma |
| Yaqui | 0.0 /100 | #314 | Tragic 84.7% |
| Puerto Ricans | 0.0 /100 | #315 | Tragic 84.7% |
| Belizeans | 0.0 /100 | #316 | Tragic 84.3% |
| Immigrants | Caribbean | 0.0 /100 | #317 | Tragic 84.3% |
| Immigrants | Belize | 0.0 /100 | #318 | Tragic 84.2% |
| Central American Indians | 0.0 /100 | #319 | Tragic 84.2% |
| Nicaraguans | 0.0 /100 | #320 | Tragic 84.1% |
| Yuman | 0.0 /100 | #321 | Tragic 84.0% |
| Lumbee | 0.0 /100 | #322 | Tragic 83.6% |
| Immigrants | Cuba | 0.0 /100 | #323 | Tragic 83.5% |
| Immigrants | Cabo Verde | 0.0 /100 | #324 | Tragic 83.3% |
| Immigrants | Nicaragua | 0.0 /100 | #325 | Tragic 83.1% |
| Mexican American Indians | 0.0 /100 | #326 | Tragic 83.0% |
| Hondurans | 0.0 /100 | #327 | Tragic 83.0% |
| Dominicans | 0.0 /100 | #328 | Tragic 82.9% |
Demographics Similar to Immigrants from Taiwan by High School Diploma
In terms of high school diploma, the demographic groups most similar to Immigrants from Taiwan are Immigrants from Japan (91.0%, a difference of 0.010%), Austrian (91.0%, a difference of 0.020%), Slavic (91.0%, a difference of 0.040%), Immigrants from North America (91.0%, a difference of 0.040%), and Zimbabwean (91.1%, a difference of 0.050%).
| Demographics | Rating | Rank | High School Diploma |
| Macedonians | 99.7 /100 | #54 | Exceptional 91.1% |
| Serbians | 99.7 /100 | #55 | Exceptional 91.1% |
| Immigrants | Canada | 99.7 /100 | #56 | Exceptional 91.1% |
| Zimbabweans | 99.7 /100 | #57 | Exceptional 91.1% |
| Slavs | 99.7 /100 | #58 | Exceptional 91.0% |
| Immigrants | North America | 99.7 /100 | #59 | Exceptional 91.0% |
| Immigrants | Japan | 99.6 /100 | #60 | Exceptional 91.0% |
| Immigrants | Taiwan | 99.6 /100 | #61 | Exceptional 91.0% |
| Austrians | 99.6 /100 | #62 | Exceptional 91.0% |
| Immigrants | Netherlands | 99.6 /100 | #63 | Exceptional 91.0% |
| Ukrainians | 99.6 /100 | #64 | Exceptional 91.0% |
| Immigrants | South Africa | 99.6 /100 | #65 | Exceptional 91.0% |
| French | 99.5 /100 | #66 | Exceptional 91.0% |
| Immigrants | Iran | 99.5 /100 | #67 | Exceptional 90.9% |
| Czechoslovakians | 99.5 /100 | #68 | Exceptional 90.9% |