Yuman vs Syrian Doctorate Degree
COMPARE
Yuman
Syrian
Doctorate Degree
Doctorate Degree Comparison
Yuman
Syrians
1.5%
DOCTORATE DEGREE
1.1/ 100
METRIC RATING
252nd/ 347
METRIC RANK
2.1%
DOCTORATE DEGREE
97.1/ 100
METRIC RATING
112th/ 347
METRIC RANK
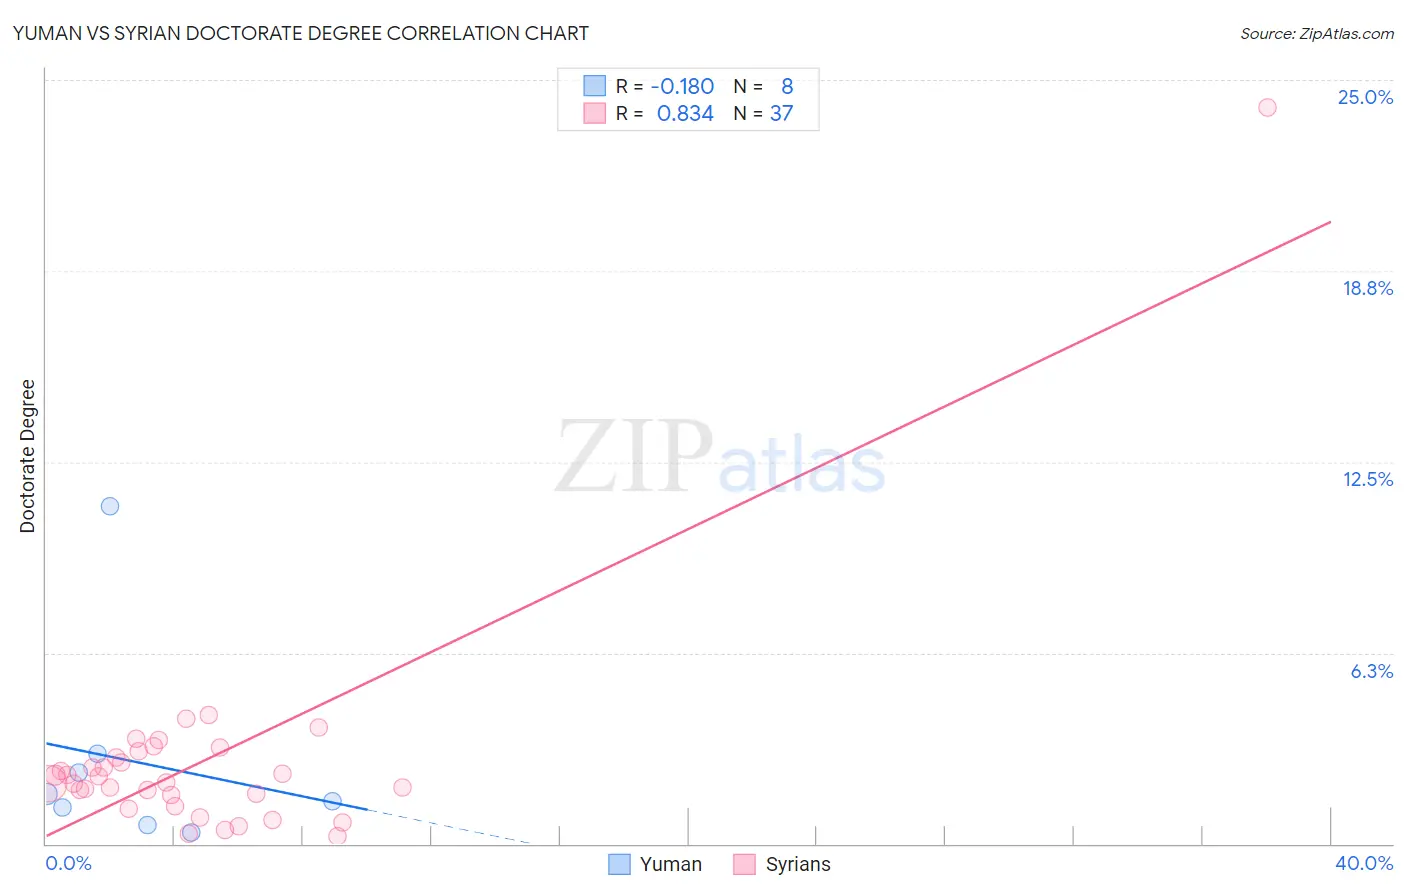
Yuman vs Syrian Doctorate Degree Correlation Chart
The statistical analysis conducted on geographies consisting of 40,365,852 people shows a poor negative correlation between the proportion of Yuman and percentage of population with at least doctorate degree education in the United States with a correlation coefficient (R) of -0.180 and weighted average of 1.5%. Similarly, the statistical analysis conducted on geographies consisting of 265,258,861 people shows a very strong positive correlation between the proportion of Syrians and percentage of population with at least doctorate degree education in the United States with a correlation coefficient (R) of 0.834 and weighted average of 2.1%, a difference of 35.4%.
Doctorate Degree Correlation Summary
| Measurement | Yuman | Syrian |
| Minimum | 0.38% | 0.24% |
| Maximum | 11.1% | 24.1% |
| Range | 10.7% | 23.9% |
| Mean | 2.7% | 2.7% |
| Median | 1.5% | 2.0% |
| Interquartile 25% (IQ1) | 0.89% | 1.4% |
| Interquartile 75% (IQ3) | 2.7% | 2.9% |
| Interquartile Range (IQR) | 1.8% | 1.5% |
| Standard Deviation (Sample) | 3.5% | 3.8% |
| Standard Deviation (Population) | 3.3% | 3.7% |
Similar Demographics by Doctorate Degree
Demographics Similar to Yuman by Doctorate Degree
In terms of doctorate degree, the demographic groups most similar to Yuman are American (1.5%, a difference of 0.15%), Immigrants from Cambodia (1.5%, a difference of 0.28%), Trinidadian and Tobagonian (1.5%, a difference of 0.28%), Central American Indian (1.5%, a difference of 0.33%), and Chippewa (1.5%, a difference of 0.55%).
| Demographics | Rating | Rank | Doctorate Degree |
| Delaware | 1.9 /100 | #245 | Tragic 1.6% |
| Hmong | 1.8 /100 | #246 | Tragic 1.6% |
| Comanche | 1.8 /100 | #247 | Tragic 1.6% |
| Africans | 1.8 /100 | #248 | Tragic 1.6% |
| Potawatomi | 1.6 /100 | #249 | Tragic 1.6% |
| Immigrants | Fiji | 1.6 /100 | #250 | Tragic 1.6% |
| Apache | 1.3 /100 | #251 | Tragic 1.5% |
| Yuman | 1.1 /100 | #252 | Tragic 1.5% |
| Americans | 1.0 /100 | #253 | Tragic 1.5% |
| Immigrants | Cambodia | 1.0 /100 | #254 | Tragic 1.5% |
| Trinidadians and Tobagonians | 1.0 /100 | #255 | Tragic 1.5% |
| Central American Indians | 1.0 /100 | #256 | Tragic 1.5% |
| Chippewa | 0.9 /100 | #257 | Tragic 1.5% |
| Immigrants | West Indies | 0.9 /100 | #258 | Tragic 1.5% |
| Liberians | 0.9 /100 | #259 | Tragic 1.5% |
Demographics Similar to Syrians by Doctorate Degree
In terms of doctorate degree, the demographic groups most similar to Syrians are Immigrants from Pakistan (2.1%, a difference of 0.020%), Brazilian (2.1%, a difference of 0.080%), Ukrainian (2.1%, a difference of 0.15%), Immigrants from Germany (2.1%, a difference of 0.21%), and Immigrants from Italy (2.1%, a difference of 0.21%).
| Demographics | Rating | Rank | Doctorate Degree |
| Arabs | 97.8 /100 | #105 | Exceptional 2.1% |
| Sudanese | 97.7 /100 | #106 | Exceptional 2.1% |
| Europeans | 97.5 /100 | #107 | Exceptional 2.1% |
| Immigrants | Germany | 97.3 /100 | #108 | Exceptional 2.1% |
| Ukrainians | 97.2 /100 | #109 | Exceptional 2.1% |
| Brazilians | 97.2 /100 | #110 | Exceptional 2.1% |
| Immigrants | Pakistan | 97.1 /100 | #111 | Exceptional 2.1% |
| Syrians | 97.1 /100 | #112 | Exceptional 2.1% |
| Immigrants | Italy | 96.9 /100 | #113 | Exceptional 2.1% |
| Immigrants | Croatia | 96.8 /100 | #114 | Exceptional 2.1% |
| Taiwanese | 96.7 /100 | #115 | Exceptional 2.1% |
| Maltese | 96.2 /100 | #116 | Exceptional 2.1% |
| Lebanese | 96.0 /100 | #117 | Exceptional 2.1% |
| Icelanders | 96.0 /100 | #118 | Exceptional 2.1% |
| Pakistanis | 95.8 /100 | #119 | Exceptional 2.0% |