Immigrants from Latin America vs Palestinian No Schooling Completed
COMPARE
Immigrants from Latin America
Palestinian
No Schooling Completed
No Schooling Completed Comparison
Immigrants from Latin America
Palestinians
3.3%
NO SCHOOLING COMPLETED
0.0/ 100
METRIC RATING
327th/ 347
METRIC RANK
1.9%
NO SCHOOLING COMPLETED
91.8/ 100
METRIC RATING
130th/ 347
METRIC RANK
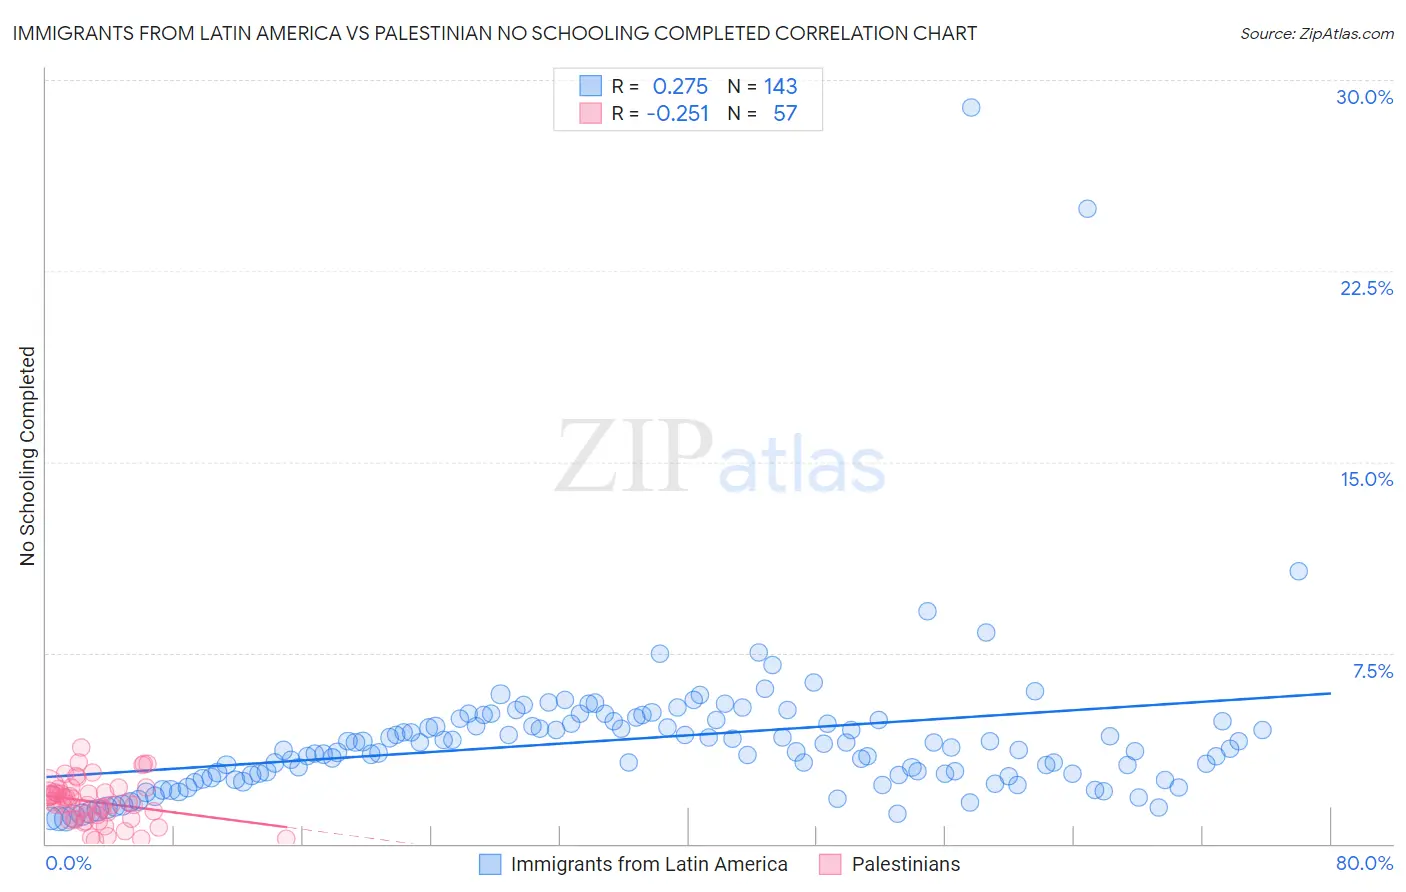
Immigrants from Latin America vs Palestinian No Schooling Completed Correlation Chart
The statistical analysis conducted on geographies consisting of 544,626,329 people shows a weak positive correlation between the proportion of Immigrants from Latin America and percentage of population with no schooling in the United States with a correlation coefficient (R) of 0.275 and weighted average of 3.3%. Similarly, the statistical analysis conducted on geographies consisting of 215,613,106 people shows a weak negative correlation between the proportion of Palestinians and percentage of population with no schooling in the United States with a correlation coefficient (R) of -0.251 and weighted average of 1.9%, a difference of 71.1%.
No Schooling Completed Correlation Summary
| Measurement | Immigrants from Latin America | Palestinian |
| Minimum | 0.98% | 0.16% |
| Maximum | 28.9% | 3.8% |
| Range | 27.9% | 3.6% |
| Mean | 4.1% | 1.6% |
| Median | 3.7% | 1.6% |
| Interquartile 25% (IQ1) | 2.7% | 0.98% |
| Interquartile 75% (IQ3) | 4.8% | 2.1% |
| Interquartile Range (IQR) | 2.2% | 1.1% |
| Standard Deviation (Sample) | 3.2% | 0.83% |
| Standard Deviation (Population) | 3.2% | 0.82% |
Similar Demographics by No Schooling Completed
Demographics Similar to Immigrants from Latin America by No Schooling Completed
In terms of no schooling completed, the demographic groups most similar to Immigrants from Latin America are Mexican (3.3%, a difference of 0.22%), Immigrants from Vietnam (3.3%, a difference of 1.3%), Immigrants from Armenia (3.3%, a difference of 1.7%), Japanese (3.3%, a difference of 1.8%), and Indonesian (3.2%, a difference of 2.5%).
| Demographics | Rating | Rank | No Schooling Completed |
| Immigrants | Bangladesh | 0.0 /100 | #320 | Tragic 3.1% |
| Immigrants | Laos | 0.0 /100 | #321 | Tragic 3.1% |
| Immigrants | Honduras | 0.0 /100 | #322 | Tragic 3.2% |
| Vietnamese | 0.0 /100 | #323 | Tragic 3.2% |
| Mexican American Indians | 0.0 /100 | #324 | Tragic 3.2% |
| Dominicans | 0.0 /100 | #325 | Tragic 3.2% |
| Indonesians | 0.0 /100 | #326 | Tragic 3.2% |
| Immigrants | Latin America | 0.0 /100 | #327 | Tragic 3.3% |
| Mexicans | 0.0 /100 | #328 | Tragic 3.3% |
| Immigrants | Vietnam | 0.0 /100 | #329 | Tragic 3.3% |
| Immigrants | Armenia | 0.0 /100 | #330 | Tragic 3.3% |
| Japanese | 0.0 /100 | #331 | Tragic 3.3% |
| Central Americans | 0.0 /100 | #332 | Tragic 3.4% |
| Immigrants | Dominican Republic | 0.0 /100 | #333 | Tragic 3.4% |
| Guatemalans | 0.0 /100 | #334 | Tragic 3.5% |
Demographics Similar to Palestinians by No Schooling Completed
In terms of no schooling completed, the demographic groups most similar to Palestinians are Seminole (1.9%, a difference of 0.11%), Immigrants from Hungary (1.9%, a difference of 0.11%), Spaniard (1.9%, a difference of 0.25%), Israeli (1.9%, a difference of 0.33%), and Immigrants from Romania (1.9%, a difference of 0.40%).
| Demographics | Rating | Rank | No Schooling Completed |
| Immigrants | Kuwait | 93.9 /100 | #123 | Exceptional 1.9% |
| Cambodians | 93.8 /100 | #124 | Exceptional 1.9% |
| Immigrants | Europe | 93.7 /100 | #125 | Exceptional 1.9% |
| Immigrants | Romania | 92.6 /100 | #126 | Exceptional 1.9% |
| Israelis | 92.4 /100 | #127 | Exceptional 1.9% |
| Spaniards | 92.3 /100 | #128 | Exceptional 1.9% |
| Seminole | 92.0 /100 | #129 | Exceptional 1.9% |
| Palestinians | 91.8 /100 | #130 | Exceptional 1.9% |
| Immigrants | Hungary | 91.6 /100 | #131 | Exceptional 1.9% |
| Colville | 90.4 /100 | #132 | Exceptional 1.9% |
| Immigrants | Turkey | 90.2 /100 | #133 | Exceptional 1.9% |
| Menominee | 89.6 /100 | #134 | Excellent 1.9% |
| Hmong | 88.5 /100 | #135 | Excellent 1.9% |
| Burmese | 88.2 /100 | #136 | Excellent 1.9% |
| Filipinos | 85.5 /100 | #137 | Excellent 2.0% |