Yuman vs Immigrants from Taiwan 1st Grade
COMPARE
Yuman
Immigrants from Taiwan
1st Grade
1st Grade Comparison
Yuman
Immigrants from Taiwan
97.8%
1ST GRADE
24.4/ 100
METRIC RATING
198th/ 347
METRIC RANK
97.9%
1ST GRADE
29.4/ 100
METRIC RATING
193rd/ 347
METRIC RANK
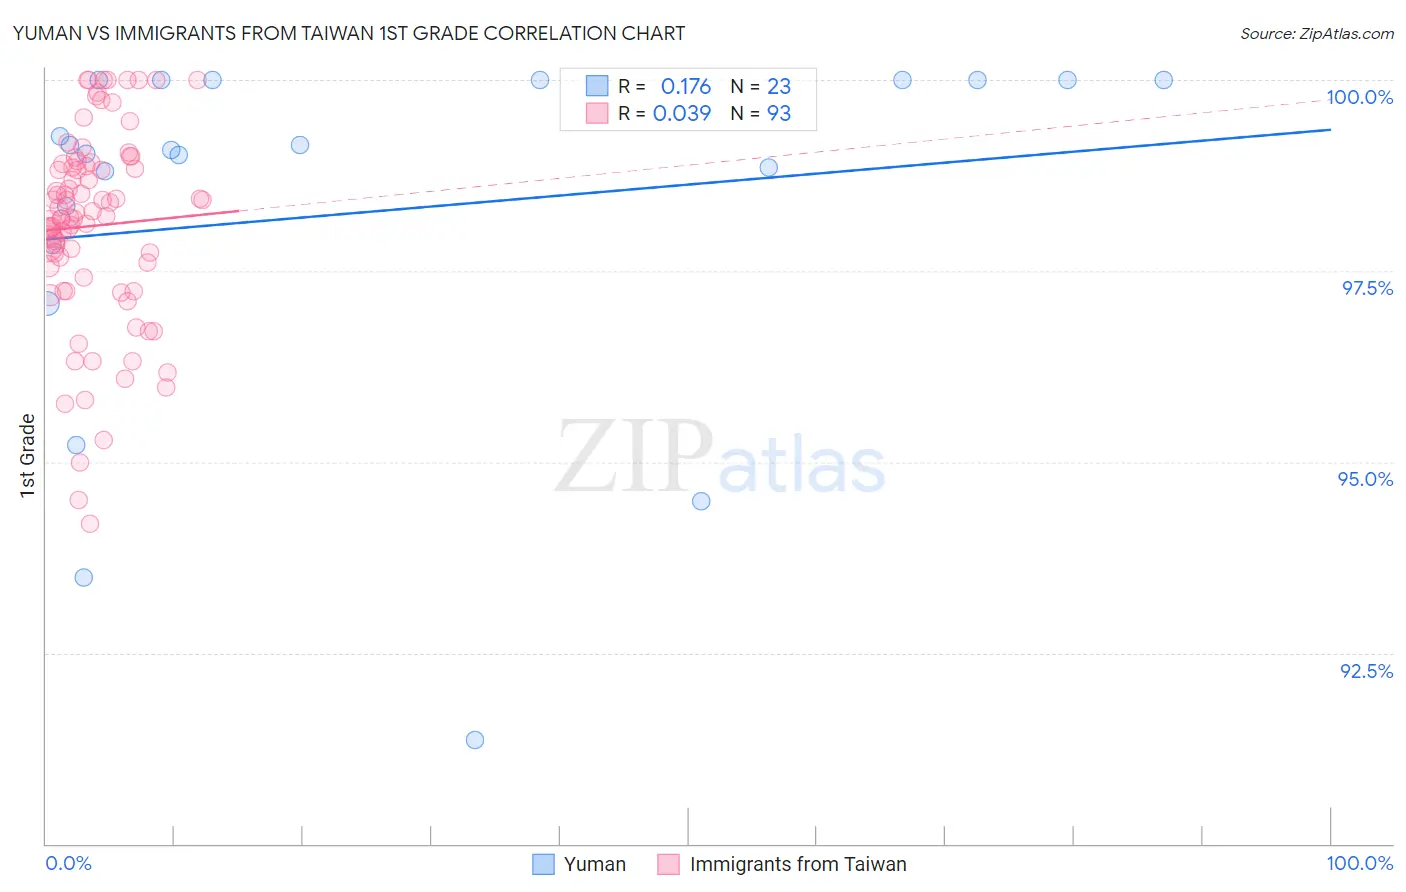
Yuman vs Immigrants from Taiwan 1st Grade Correlation Chart
The statistical analysis conducted on geographies consisting of 40,696,349 people shows a poor positive correlation between the proportion of Yuman and percentage of population with at least 1st grade education in the United States with a correlation coefficient (R) of 0.176 and weighted average of 97.8%. Similarly, the statistical analysis conducted on geographies consisting of 298,069,082 people shows no correlation between the proportion of Immigrants from Taiwan and percentage of population with at least 1st grade education in the United States with a correlation coefficient (R) of 0.039 and weighted average of 97.9%, a difference of 0.020%.
1st Grade Correlation Summary
| Measurement | Yuman | Immigrants from Taiwan |
| Minimum | 91.4% | 94.2% |
| Maximum | 100.0% | 100.0% |
| Range | 8.6% | 5.8% |
| Mean | 98.3% | 98.1% |
| Median | 99.1% | 98.2% |
| Interquartile 25% (IQ1) | 97.8% | 97.5% |
| Interquartile 75% (IQ3) | 100.0% | 98.9% |
| Interquartile Range (IQR) | 2.2% | 1.4% |
| Standard Deviation (Sample) | 2.4% | 1.3% |
| Standard Deviation (Population) | 2.3% | 1.3% |
Demographics Similar to Yuman and Immigrants from Taiwan by 1st Grade
In terms of 1st grade, the demographic groups most similar to Yuman are Immigrants from Kenya (97.8%, a difference of 0.010%), Guamanian/Chamorro (97.8%, a difference of 0.010%), Tohono O'odham (97.8%, a difference of 0.010%), Immigrants from Egypt (97.8%, a difference of 0.010%), and Black/African American (97.9%, a difference of 0.020%). Similarly, the demographic groups most similar to Immigrants from Taiwan are Black/African American (97.9%, a difference of 0.0%), Paraguayan (97.9%, a difference of 0.0%), Mongolian (97.9%, a difference of 0.0%), Hawaiian (97.9%, a difference of 0.0%), and Immigrants from Kenya (97.8%, a difference of 0.010%).
| Demographics | Rating | Rank | 1st Grade |
| Immigrants | Belarus | 39.3 /100 | #185 | Fair 97.9% |
| Paiute | 36.5 /100 | #186 | Fair 97.9% |
| Pakistanis | 35.8 /100 | #187 | Fair 97.9% |
| Arabs | 35.5 /100 | #188 | Fair 97.9% |
| Immigrants | Kazakhstan | 34.9 /100 | #189 | Fair 97.9% |
| Panamanians | 34.1 /100 | #190 | Fair 97.9% |
| Blacks/African Americans | 30.7 /100 | #191 | Fair 97.9% |
| Paraguayans | 30.2 /100 | #192 | Fair 97.9% |
| Immigrants | Taiwan | 29.4 /100 | #193 | Fair 97.9% |
| Mongolians | 29.2 /100 | #194 | Fair 97.9% |
| Hawaiians | 28.8 /100 | #195 | Fair 97.9% |
| Immigrants | Kenya | 26.3 /100 | #196 | Fair 97.8% |
| Guamanians/Chamorros | 26.2 /100 | #197 | Fair 97.8% |
| Yuman | 24.4 /100 | #198 | Fair 97.8% |
| Tohono O'odham | 23.2 /100 | #199 | Fair 97.8% |
| Immigrants | Egypt | 22.6 /100 | #200 | Fair 97.8% |
| Immigrants | Lebanon | 20.1 /100 | #201 | Fair 97.8% |
| Immigrants | Ukraine | 19.2 /100 | #202 | Poor 97.8% |
| Immigrants | Southern Europe | 18.2 /100 | #203 | Poor 97.8% |
| Immigrants | Uganda | 18.2 /100 | #204 | Poor 97.8% |
| Immigrants | Chile | 17.7 /100 | #205 | Poor 97.8% |