Tlingit-Haida vs Immigrants from Denmark Nursery School
COMPARE
Tlingit-Haida
Immigrants from Denmark
Nursery School
Nursery School Comparison
Tlingit-Haida
Immigrants from Denmark
98.7%
NURSERY SCHOOL
100.0/ 100
METRIC RATING
11th/ 347
METRIC RANK
98.3%
NURSERY SCHOOL
99.1/ 100
METRIC RATING
84th/ 347
METRIC RANK
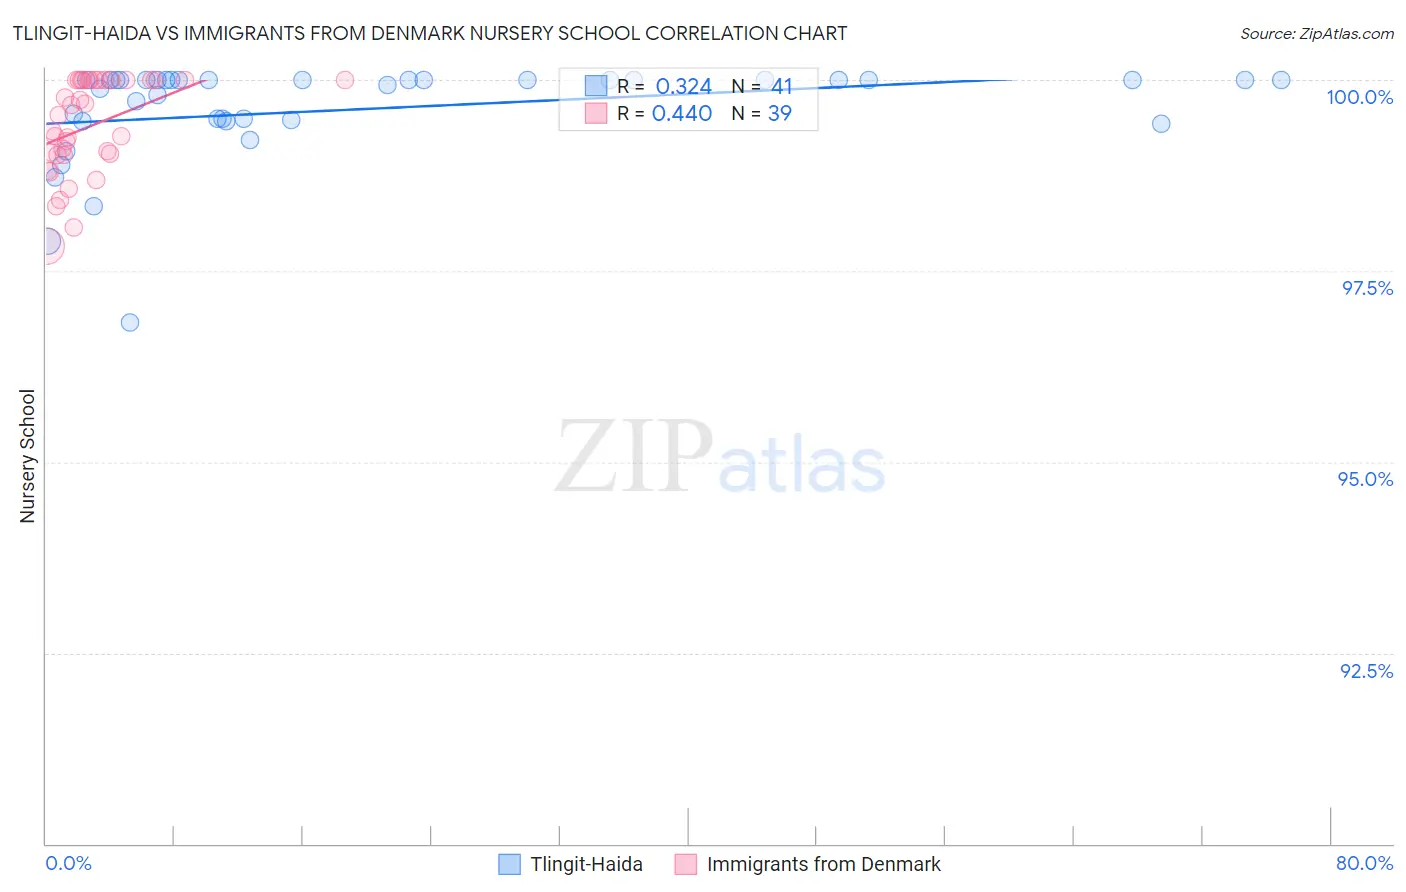
Tlingit-Haida vs Immigrants from Denmark Nursery School Correlation Chart
The statistical analysis conducted on geographies consisting of 60,865,648 people shows a mild positive correlation between the proportion of Tlingit-Haida and percentage of population with at least nursery school education in the United States with a correlation coefficient (R) of 0.324 and weighted average of 98.7%. Similarly, the statistical analysis conducted on geographies consisting of 136,428,049 people shows a moderate positive correlation between the proportion of Immigrants from Denmark and percentage of population with at least nursery school education in the United States with a correlation coefficient (R) of 0.440 and weighted average of 98.3%, a difference of 0.40%.
Nursery School Correlation Summary
| Measurement | Tlingit-Haida | Immigrants from Denmark |
| Minimum | 96.8% | 97.8% |
| Maximum | 100.0% | 100.0% |
| Range | 3.2% | 2.2% |
| Mean | 99.6% | 99.4% |
| Median | 100.0% | 99.5% |
| Interquartile 25% (IQ1) | 99.5% | 99.0% |
| Interquartile 75% (IQ3) | 100.0% | 100.0% |
| Interquartile Range (IQR) | 0.53% | 0.98% |
| Standard Deviation (Sample) | 0.67% | 0.63% |
| Standard Deviation (Population) | 0.66% | 0.62% |
Similar Demographics by Nursery School
Demographics Similar to Tlingit-Haida by Nursery School
In terms of nursery school, the demographic groups most similar to Tlingit-Haida are German (98.7%, a difference of 0.0%), Slovak (98.7%, a difference of 0.010%), Norwegian (98.7%, a difference of 0.020%), Slovene (98.7%, a difference of 0.020%), and English (98.7%, a difference of 0.030%).
| Demographics | Rating | Rank | Nursery School |
| Inupiat | 100.0 /100 | #4 | Exceptional 98.9% |
| Tsimshian | 100.0 /100 | #5 | Exceptional 98.9% |
| Alaskan Athabascans | 100.0 /100 | #6 | Exceptional 98.8% |
| Alaska Natives | 100.0 /100 | #7 | Exceptional 98.8% |
| Norwegians | 100.0 /100 | #8 | Exceptional 98.7% |
| Slovaks | 100.0 /100 | #9 | Exceptional 98.7% |
| Germans | 100.0 /100 | #10 | Exceptional 98.7% |
| Tlingit-Haida | 100.0 /100 | #11 | Exceptional 98.7% |
| Slovenes | 100.0 /100 | #12 | Exceptional 98.7% |
| English | 100.0 /100 | #13 | Exceptional 98.7% |
| Carpatho Rusyns | 100.0 /100 | #14 | Exceptional 98.7% |
| Swedes | 100.0 /100 | #15 | Exceptional 98.7% |
| Scottish | 100.0 /100 | #16 | Exceptional 98.7% |
| Aleuts | 100.0 /100 | #17 | Exceptional 98.7% |
| Dutch | 100.0 /100 | #18 | Exceptional 98.7% |
Demographics Similar to Immigrants from Denmark by Nursery School
In terms of nursery school, the demographic groups most similar to Immigrants from Denmark are Osage (98.3%, a difference of 0.0%), Immigrants from Sweden (98.3%, a difference of 0.0%), Shoshone (98.3%, a difference of 0.010%), Icelander (98.3%, a difference of 0.010%), and Potawatomi (98.3%, a difference of 0.010%).
| Demographics | Rating | Rank | Nursery School |
| Immigrants | Lithuania | 99.3 /100 | #77 | Exceptional 98.3% |
| Delaware | 99.3 /100 | #78 | Exceptional 98.3% |
| Immigrants | Belgium | 99.3 /100 | #79 | Exceptional 98.3% |
| Shoshone | 99.3 /100 | #80 | Exceptional 98.3% |
| Icelanders | 99.2 /100 | #81 | Exceptional 98.3% |
| Potawatomi | 99.2 /100 | #82 | Exceptional 98.3% |
| Osage | 99.1 /100 | #83 | Exceptional 98.3% |
| Immigrants | Denmark | 99.1 /100 | #84 | Exceptional 98.3% |
| Immigrants | Sweden | 99.1 /100 | #85 | Exceptional 98.3% |
| Immigrants | Australia | 99.0 /100 | #86 | Exceptional 98.3% |
| Hopi | 98.9 /100 | #87 | Exceptional 98.3% |
| Ukrainians | 98.9 /100 | #88 | Exceptional 98.3% |
| Immigrants | South Africa | 98.8 /100 | #89 | Exceptional 98.3% |
| Immigrants | Western Europe | 98.8 /100 | #90 | Exceptional 98.3% |
| Zimbabweans | 98.8 /100 | #91 | Exceptional 98.3% |