Arapaho vs Immigrants from Cambodia No Schooling Completed
COMPARE
Arapaho
Immigrants from Cambodia
No Schooling Completed
No Schooling Completed Comparison
Arapaho
Immigrants from Cambodia
2.1%
NO SCHOOLING COMPLETED
45.0/ 100
METRIC RATING
177th/ 347
METRIC RANK
3.5%
NO SCHOOLING COMPLETED
0.0/ 100
METRIC RATING
335th/ 347
METRIC RANK
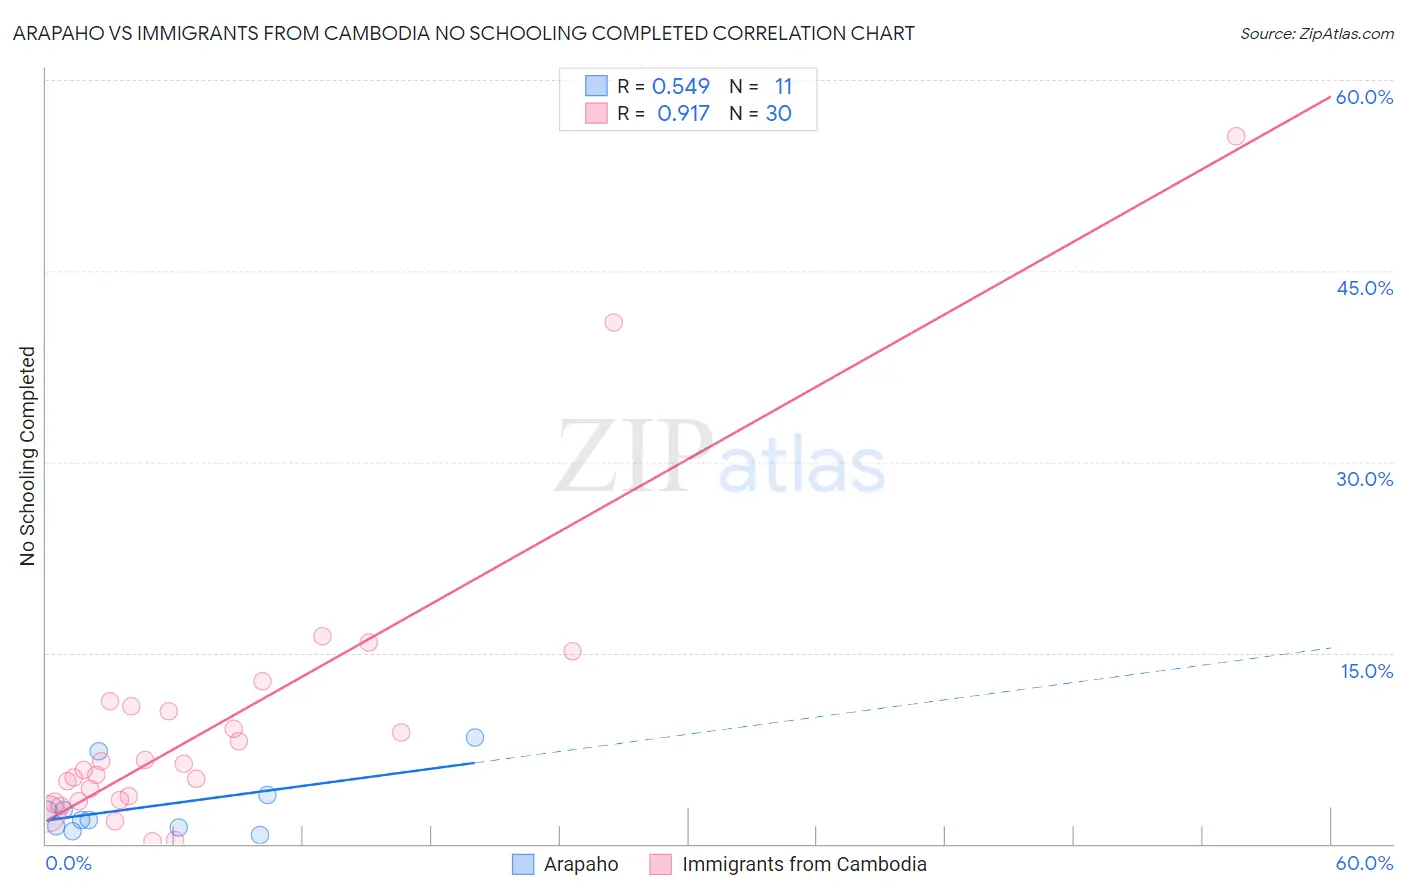
Arapaho vs Immigrants from Cambodia No Schooling Completed Correlation Chart
The statistical analysis conducted on geographies consisting of 29,619,913 people shows a substantial positive correlation between the proportion of Arapaho and percentage of population with no schooling in the United States with a correlation coefficient (R) of 0.549 and weighted average of 2.1%. Similarly, the statistical analysis conducted on geographies consisting of 204,723,315 people shows a near-perfect positive correlation between the proportion of Immigrants from Cambodia and percentage of population with no schooling in the United States with a correlation coefficient (R) of 0.917 and weighted average of 3.5%, a difference of 66.0%.
No Schooling Completed Correlation Summary
| Measurement | Arapaho | Immigrants from Cambodia |
| Minimum | 0.72% | 0.15% |
| Maximum | 8.3% | 55.6% |
| Range | 7.6% | 55.4% |
| Mean | 3.0% | 9.5% |
| Median | 1.9% | 6.0% |
| Interquartile 25% (IQ1) | 1.3% | 3.4% |
| Interquartile 75% (IQ3) | 3.8% | 10.8% |
| Interquartile Range (IQR) | 2.6% | 7.4% |
| Standard Deviation (Sample) | 2.5% | 11.5% |
| Standard Deviation (Population) | 2.4% | 11.4% |
Similar Demographics by No Schooling Completed
Demographics Similar to Arapaho by No Schooling Completed
In terms of no schooling completed, the demographic groups most similar to Arapaho are Panamanian (2.1%, a difference of 0.020%), Pakistani (2.1%, a difference of 0.040%), Immigrants from Kazakhstan (2.1%, a difference of 0.10%), Portuguese (2.1%, a difference of 0.16%), and Arab (2.1%, a difference of 0.19%).
| Demographics | Rating | Rank | No Schooling Completed |
| Argentineans | 56.0 /100 | #170 | Average 2.1% |
| Immigrants | Poland | 55.2 /100 | #171 | Average 2.1% |
| Immigrants | Argentina | 52.7 /100 | #172 | Average 2.1% |
| Immigrants | Belarus | 51.8 /100 | #173 | Average 2.1% |
| Immigrants | Micronesia | 50.0 /100 | #174 | Average 2.1% |
| Arabs | 46.4 /100 | #175 | Average 2.1% |
| Panamanians | 45.2 /100 | #176 | Average 2.1% |
| Arapaho | 45.0 /100 | #177 | Average 2.1% |
| Pakistanis | 44.7 /100 | #178 | Average 2.1% |
| Immigrants | Kazakhstan | 44.3 /100 | #179 | Average 2.1% |
| Portuguese | 43.9 /100 | #180 | Average 2.1% |
| Immigrants | Taiwan | 42.6 /100 | #181 | Average 2.1% |
| French American Indians | 42.2 /100 | #182 | Average 2.1% |
| Blacks/African Americans | 41.4 /100 | #183 | Average 2.1% |
| Pima | 41.3 /100 | #184 | Average 2.1% |
Demographics Similar to Immigrants from Cambodia by No Schooling Completed
In terms of no schooling completed, the demographic groups most similar to Immigrants from Cambodia are Immigrants from Fiji (3.5%, a difference of 0.37%), Guatemalan (3.5%, a difference of 1.0%), Immigrants from Cabo Verde (3.5%, a difference of 1.1%), Bangladeshi (3.5%, a difference of 1.3%), and Yakama (3.6%, a difference of 1.6%).
| Demographics | Rating | Rank | No Schooling Completed |
| Mexicans | 0.0 /100 | #328 | Tragic 3.3% |
| Immigrants | Vietnam | 0.0 /100 | #329 | Tragic 3.3% |
| Immigrants | Armenia | 0.0 /100 | #330 | Tragic 3.3% |
| Japanese | 0.0 /100 | #331 | Tragic 3.3% |
| Central Americans | 0.0 /100 | #332 | Tragic 3.4% |
| Immigrants | Dominican Republic | 0.0 /100 | #333 | Tragic 3.4% |
| Guatemalans | 0.0 /100 | #334 | Tragic 3.5% |
| Immigrants | Cambodia | 0.0 /100 | #335 | Tragic 3.5% |
| Immigrants | Fiji | 0.0 /100 | #336 | Tragic 3.5% |
| Immigrants | Cabo Verde | 0.0 /100 | #337 | Tragic 3.5% |
| Bangladeshis | 0.0 /100 | #338 | Tragic 3.5% |
| Yakama | 0.0 /100 | #339 | Tragic 3.6% |
| Immigrants | Guatemala | 0.0 /100 | #340 | Tragic 3.6% |
| Immigrants | Central America | 0.0 /100 | #341 | Tragic 3.6% |
| Immigrants | Mexico | 0.0 /100 | #342 | Tragic 3.6% |