Yugoslavian vs Malaysian Nursery School
COMPARE
Yugoslavian
Malaysian
Nursery School
Nursery School Comparison
Yugoslavians
Malaysians
98.2%
NURSERY SCHOOL
95.4/ 100
METRIC RATING
118th/ 347
METRIC RANK
97.3%
NURSERY SCHOOL
0.0/ 100
METRIC RATING
293rd/ 347
METRIC RANK
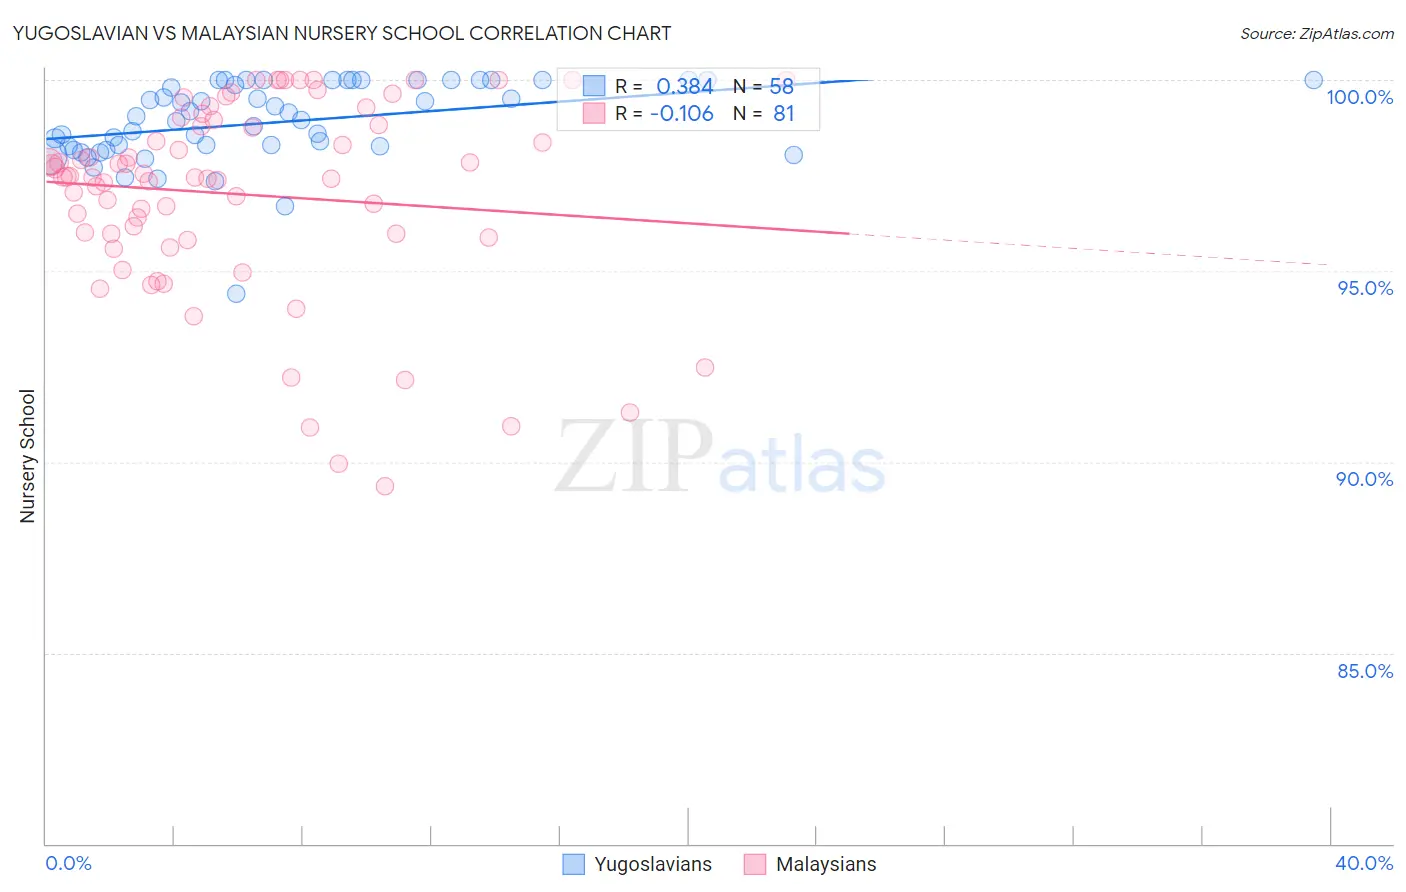
Yugoslavian vs Malaysian Nursery School Correlation Chart
The statistical analysis conducted on geographies consisting of 285,681,276 people shows a mild positive correlation between the proportion of Yugoslavians and percentage of population with at least nursery school education in the United States with a correlation coefficient (R) of 0.384 and weighted average of 98.2%. Similarly, the statistical analysis conducted on geographies consisting of 226,107,000 people shows a poor negative correlation between the proportion of Malaysians and percentage of population with at least nursery school education in the United States with a correlation coefficient (R) of -0.106 and weighted average of 97.3%, a difference of 0.97%.
Nursery School Correlation Summary
| Measurement | Yugoslavian | Malaysian |
| Minimum | 94.4% | 89.4% |
| Maximum | 100.0% | 100.0% |
| Range | 5.6% | 10.6% |
| Mean | 98.9% | 97.0% |
| Median | 99.0% | 97.5% |
| Interquartile 25% (IQ1) | 98.2% | 95.9% |
| Interquartile 75% (IQ3) | 100.0% | 98.9% |
| Interquartile Range (IQR) | 1.8% | 3.0% |
| Standard Deviation (Sample) | 1.1% | 2.5% |
| Standard Deviation (Population) | 1.1% | 2.5% |
Similar Demographics by Nursery School
Demographics Similar to Yugoslavians by Nursery School
In terms of nursery school, the demographic groups most similar to Yugoslavians are Immigrants from France (98.2%, a difference of 0.0%), Spanish (98.2%, a difference of 0.010%), Thai (98.2%, a difference of 0.010%), Okinawan (98.2%, a difference of 0.010%), and Immigrants from Norway (98.2%, a difference of 0.020%).
| Demographics | Rating | Rank | Nursery School |
| Immigrants | Czechoslovakia | 96.8 /100 | #111 | Exceptional 98.2% |
| Immigrants | Norway | 96.6 /100 | #112 | Exceptional 98.2% |
| Immigrants | Latvia | 96.4 /100 | #113 | Exceptional 98.2% |
| Ute | 96.4 /100 | #114 | Exceptional 98.2% |
| Iranians | 96.3 /100 | #115 | Exceptional 98.2% |
| Spanish | 95.8 /100 | #116 | Exceptional 98.2% |
| Immigrants | France | 95.6 /100 | #117 | Exceptional 98.2% |
| Yugoslavians | 95.4 /100 | #118 | Exceptional 98.2% |
| Thais | 95.0 /100 | #119 | Exceptional 98.2% |
| Okinawans | 94.5 /100 | #120 | Exceptional 98.2% |
| Immigrants | Zimbabwe | 94.2 /100 | #121 | Exceptional 98.2% |
| Immigrants | Japan | 94.0 /100 | #122 | Exceptional 98.2% |
| Syrians | 93.9 /100 | #123 | Exceptional 98.2% |
| Lebanese | 93.8 /100 | #124 | Exceptional 98.2% |
| Iroquois | 93.7 /100 | #125 | Exceptional 98.2% |
Demographics Similar to Malaysians by Nursery School
In terms of nursery school, the demographic groups most similar to Malaysians are Houma (97.3%, a difference of 0.010%), Immigrants from Grenada (97.3%, a difference of 0.010%), Immigrants (97.2%, a difference of 0.020%), British West Indian (97.3%, a difference of 0.030%), and Immigrants from Eritrea (97.2%, a difference of 0.030%).
| Demographics | Rating | Rank | Nursery School |
| Immigrants | Portugal | 0.0 /100 | #286 | Tragic 97.4% |
| Immigrants | Hong Kong | 0.0 /100 | #287 | Tragic 97.4% |
| Immigrants | Thailand | 0.0 /100 | #288 | Tragic 97.3% |
| Immigrants | St. Vincent and the Grenadines | 0.0 /100 | #289 | Tragic 97.3% |
| Immigrants | Afghanistan | 0.0 /100 | #290 | Tragic 97.3% |
| British West Indians | 0.0 /100 | #291 | Tragic 97.3% |
| Houma | 0.0 /100 | #292 | Tragic 97.3% |
| Malaysians | 0.0 /100 | #293 | Tragic 97.3% |
| Immigrants | Grenada | 0.0 /100 | #294 | Tragic 97.3% |
| Immigrants | Immigrants | 0.0 /100 | #295 | Tragic 97.2% |
| Immigrants | Eritrea | 0.0 /100 | #296 | Tragic 97.2% |
| Immigrants | Cuba | 0.0 /100 | #297 | Tragic 97.2% |
| Central American Indians | 0.0 /100 | #298 | Tragic 97.2% |
| Immigrants | Dominica | 0.0 /100 | #299 | Tragic 97.2% |
| Haitians | 0.0 /100 | #300 | Tragic 97.2% |