Yugoslavian vs Argentinean Nursery School
COMPARE
Yugoslavian
Argentinean
Nursery School
Nursery School Comparison
Yugoslavians
Argentineans
98.2%
NURSERY SCHOOL
95.4/ 100
METRIC RATING
118th/ 347
METRIC RANK
98.0%
NURSERY SCHOOL
46.8/ 100
METRIC RATING
179th/ 347
METRIC RANK
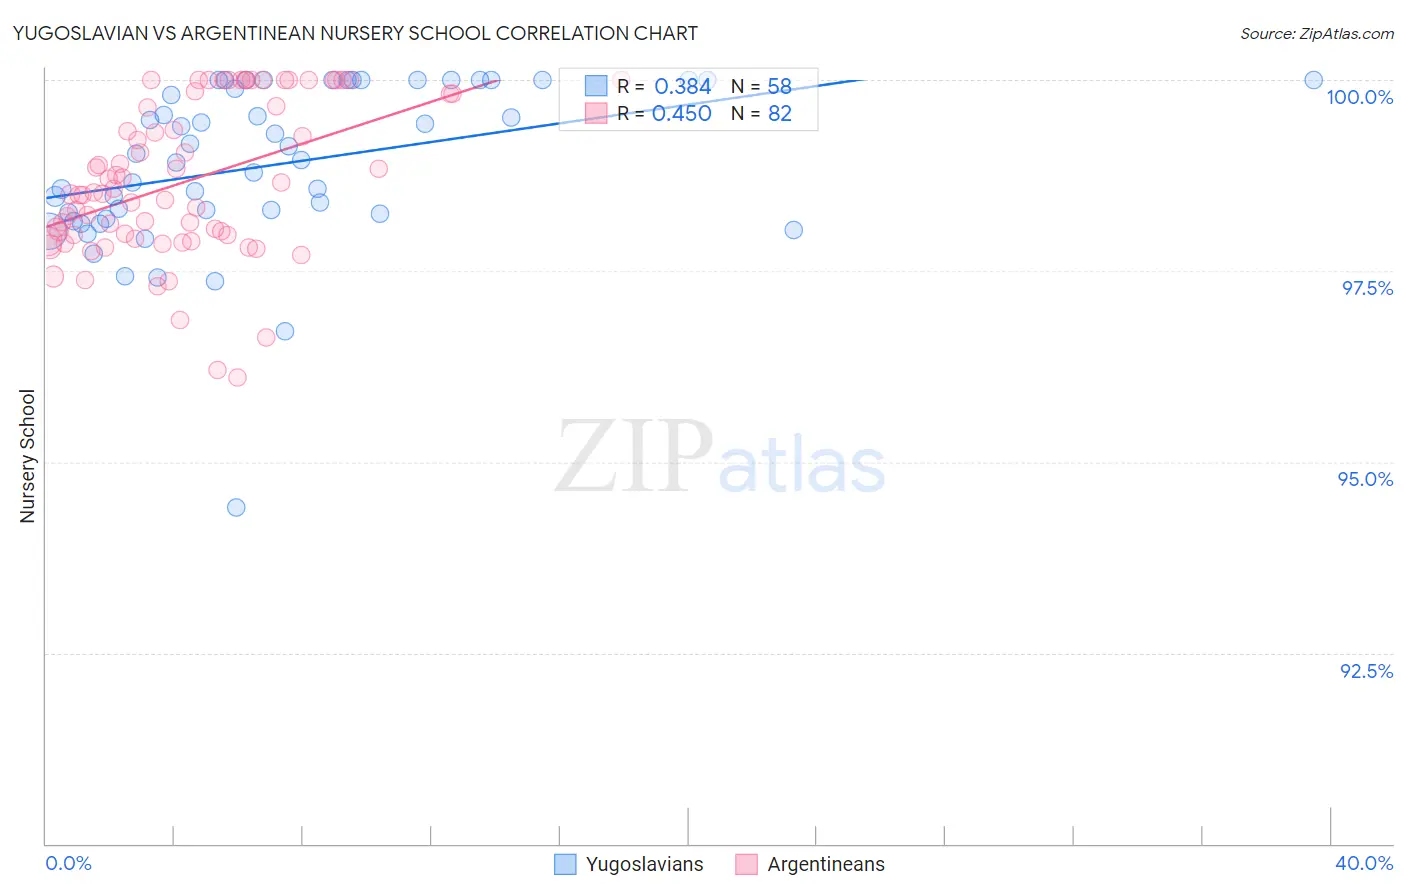
Yugoslavian vs Argentinean Nursery School Correlation Chart
The statistical analysis conducted on geographies consisting of 285,681,276 people shows a mild positive correlation between the proportion of Yugoslavians and percentage of population with at least nursery school education in the United States with a correlation coefficient (R) of 0.384 and weighted average of 98.2%. Similarly, the statistical analysis conducted on geographies consisting of 297,146,811 people shows a moderate positive correlation between the proportion of Argentineans and percentage of population with at least nursery school education in the United States with a correlation coefficient (R) of 0.450 and weighted average of 98.0%, a difference of 0.24%.
Nursery School Correlation Summary
| Measurement | Yugoslavian | Argentinean |
| Minimum | 94.4% | 96.1% |
| Maximum | 100.0% | 100.0% |
| Range | 5.6% | 3.9% |
| Mean | 98.9% | 98.7% |
| Median | 99.0% | 98.5% |
| Interquartile 25% (IQ1) | 98.2% | 98.0% |
| Interquartile 75% (IQ3) | 100.0% | 99.8% |
| Interquartile Range (IQR) | 1.8% | 1.8% |
| Standard Deviation (Sample) | 1.1% | 1.00% |
| Standard Deviation (Population) | 1.1% | 0.99% |
Similar Demographics by Nursery School
Demographics Similar to Yugoslavians by Nursery School
In terms of nursery school, the demographic groups most similar to Yugoslavians are Immigrants from France (98.2%, a difference of 0.0%), Spanish (98.2%, a difference of 0.010%), Thai (98.2%, a difference of 0.010%), Okinawan (98.2%, a difference of 0.010%), and Immigrants from Norway (98.2%, a difference of 0.020%).
| Demographics | Rating | Rank | Nursery School |
| Immigrants | Czechoslovakia | 96.8 /100 | #111 | Exceptional 98.2% |
| Immigrants | Norway | 96.6 /100 | #112 | Exceptional 98.2% |
| Immigrants | Latvia | 96.4 /100 | #113 | Exceptional 98.2% |
| Ute | 96.4 /100 | #114 | Exceptional 98.2% |
| Iranians | 96.3 /100 | #115 | Exceptional 98.2% |
| Spanish | 95.8 /100 | #116 | Exceptional 98.2% |
| Immigrants | France | 95.6 /100 | #117 | Exceptional 98.2% |
| Yugoslavians | 95.4 /100 | #118 | Exceptional 98.2% |
| Thais | 95.0 /100 | #119 | Exceptional 98.2% |
| Okinawans | 94.5 /100 | #120 | Exceptional 98.2% |
| Immigrants | Zimbabwe | 94.2 /100 | #121 | Exceptional 98.2% |
| Immigrants | Japan | 94.0 /100 | #122 | Exceptional 98.2% |
| Syrians | 93.9 /100 | #123 | Exceptional 98.2% |
| Lebanese | 93.8 /100 | #124 | Exceptional 98.2% |
| Iroquois | 93.7 /100 | #125 | Exceptional 98.2% |
Demographics Similar to Argentineans by Nursery School
In terms of nursery school, the demographic groups most similar to Argentineans are Immigrants from Bosnia and Herzegovina (98.0%, a difference of 0.0%), Immigrants from Brazil (98.0%, a difference of 0.010%), Kenyan (98.0%, a difference of 0.010%), Navajo (98.0%, a difference of 0.010%), and Immigrants from Sri Lanka (98.0%, a difference of 0.010%).
| Demographics | Rating | Rank | Nursery School |
| Immigrants | Brazil | 51.3 /100 | #172 | Average 98.0% |
| Kenyans | 50.2 /100 | #173 | Average 98.0% |
| Navajo | 50.0 /100 | #174 | Average 98.0% |
| Immigrants | Sri Lanka | 49.9 /100 | #175 | Average 98.0% |
| Immigrants | Venezuela | 49.8 /100 | #176 | Average 98.0% |
| Albanians | 48.9 /100 | #177 | Average 98.0% |
| Natives/Alaskans | 48.6 /100 | #178 | Average 98.0% |
| Argentineans | 46.8 /100 | #179 | Average 98.0% |
| Immigrants | Bosnia and Herzegovina | 45.6 /100 | #180 | Average 98.0% |
| Egyptians | 42.8 /100 | #181 | Average 98.0% |
| Paiute | 42.0 /100 | #182 | Average 98.0% |
| Portuguese | 41.8 /100 | #183 | Average 98.0% |
| Immigrants | Poland | 41.3 /100 | #184 | Average 98.0% |
| Immigrants | Belarus | 41.0 /100 | #185 | Average 98.0% |
| Immigrants | Argentina | 40.8 /100 | #186 | Average 98.0% |