Yugoslavian vs Immigrants from Argentina Nursery School
COMPARE
Yugoslavian
Immigrants from Argentina
Nursery School
Nursery School Comparison
Yugoslavians
Immigrants from Argentina
98.2%
NURSERY SCHOOL
95.4/ 100
METRIC RATING
118th/ 347
METRIC RANK
98.0%
NURSERY SCHOOL
40.8/ 100
METRIC RATING
186th/ 347
METRIC RANK
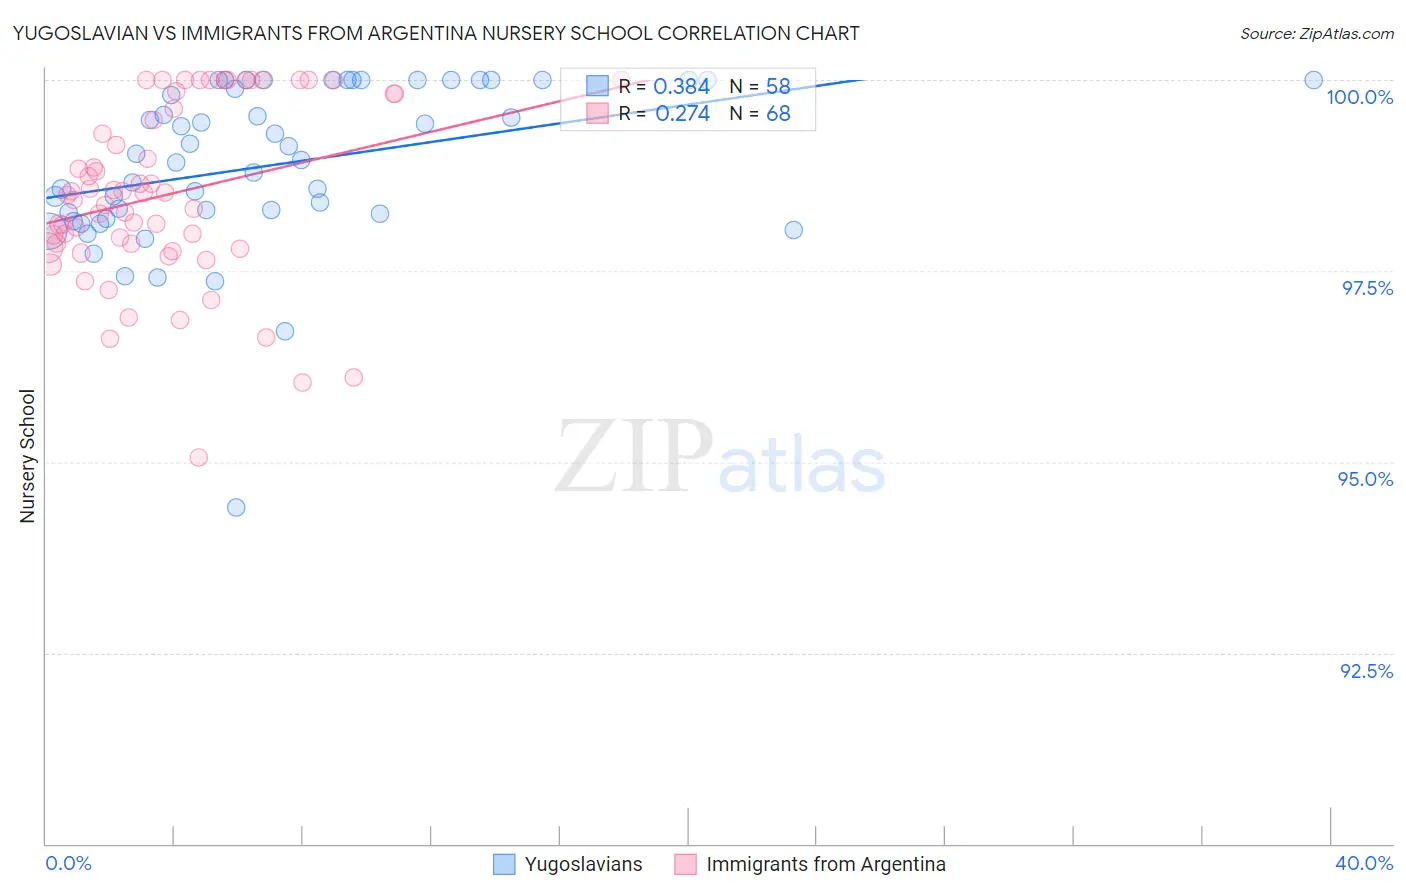
Yugoslavian vs Immigrants from Argentina Nursery School Correlation Chart
The statistical analysis conducted on geographies consisting of 285,681,276 people shows a mild positive correlation between the proportion of Yugoslavians and percentage of population with at least nursery school education in the United States with a correlation coefficient (R) of 0.384 and weighted average of 98.2%. Similarly, the statistical analysis conducted on geographies consisting of 264,435,492 people shows a weak positive correlation between the proportion of Immigrants from Argentina and percentage of population with at least nursery school education in the United States with a correlation coefficient (R) of 0.274 and weighted average of 98.0%, a difference of 0.26%.
Nursery School Correlation Summary
| Measurement | Yugoslavian | Immigrants from Argentina |
| Minimum | 94.4% | 95.1% |
| Maximum | 100.0% | 100.0% |
| Range | 5.6% | 4.9% |
| Mean | 98.9% | 98.5% |
| Median | 99.0% | 98.5% |
| Interquartile 25% (IQ1) | 98.2% | 97.8% |
| Interquartile 75% (IQ3) | 100.0% | 99.7% |
| Interquartile Range (IQR) | 1.8% | 1.9% |
| Standard Deviation (Sample) | 1.1% | 1.2% |
| Standard Deviation (Population) | 1.1% | 1.1% |
Similar Demographics by Nursery School
Demographics Similar to Yugoslavians by Nursery School
In terms of nursery school, the demographic groups most similar to Yugoslavians are Immigrants from France (98.2%, a difference of 0.0%), Spanish (98.2%, a difference of 0.010%), Thai (98.2%, a difference of 0.010%), Okinawan (98.2%, a difference of 0.010%), and Immigrants from Norway (98.2%, a difference of 0.020%).
| Demographics | Rating | Rank | Nursery School |
| Immigrants | Czechoslovakia | 96.8 /100 | #111 | Exceptional 98.2% |
| Immigrants | Norway | 96.6 /100 | #112 | Exceptional 98.2% |
| Immigrants | Latvia | 96.4 /100 | #113 | Exceptional 98.2% |
| Ute | 96.4 /100 | #114 | Exceptional 98.2% |
| Iranians | 96.3 /100 | #115 | Exceptional 98.2% |
| Spanish | 95.8 /100 | #116 | Exceptional 98.2% |
| Immigrants | France | 95.6 /100 | #117 | Exceptional 98.2% |
| Yugoslavians | 95.4 /100 | #118 | Exceptional 98.2% |
| Thais | 95.0 /100 | #119 | Exceptional 98.2% |
| Okinawans | 94.5 /100 | #120 | Exceptional 98.2% |
| Immigrants | Zimbabwe | 94.2 /100 | #121 | Exceptional 98.2% |
| Immigrants | Japan | 94.0 /100 | #122 | Exceptional 98.2% |
| Syrians | 93.9 /100 | #123 | Exceptional 98.2% |
| Lebanese | 93.8 /100 | #124 | Exceptional 98.2% |
| Iroquois | 93.7 /100 | #125 | Exceptional 98.2% |
Demographics Similar to Immigrants from Argentina by Nursery School
In terms of nursery school, the demographic groups most similar to Immigrants from Argentina are Paiute (98.0%, a difference of 0.0%), Portuguese (98.0%, a difference of 0.0%), Immigrants from Poland (98.0%, a difference of 0.0%), Immigrants from Belarus (98.0%, a difference of 0.0%), and Immigrants from Bosnia and Herzegovina (98.0%, a difference of 0.010%).
| Demographics | Rating | Rank | Nursery School |
| Argentineans | 46.8 /100 | #179 | Average 98.0% |
| Immigrants | Bosnia and Herzegovina | 45.6 /100 | #180 | Average 98.0% |
| Egyptians | 42.8 /100 | #181 | Average 98.0% |
| Paiute | 42.0 /100 | #182 | Average 98.0% |
| Portuguese | 41.8 /100 | #183 | Average 98.0% |
| Immigrants | Poland | 41.3 /100 | #184 | Average 98.0% |
| Immigrants | Belarus | 41.0 /100 | #185 | Average 98.0% |
| Immigrants | Argentina | 40.8 /100 | #186 | Average 98.0% |
| Immigrants | Kazakhstan | 37.1 /100 | #187 | Fair 97.9% |
| Arabs | 34.7 /100 | #188 | Fair 97.9% |
| Pakistanis | 34.6 /100 | #189 | Fair 97.9% |
| Panamanians | 34.3 /100 | #190 | Fair 97.9% |
| Immigrants | Taiwan | 30.6 /100 | #191 | Fair 97.9% |
| Blacks/African Americans | 29.4 /100 | #192 | Fair 97.9% |
| Paraguayans | 27.4 /100 | #193 | Fair 97.9% |