Yugoslavian vs Alaskan Athabascan 11th Grade
COMPARE
Yugoslavian
Alaskan Athabascan
11th Grade
11th Grade Comparison
Yugoslavians
Alaskan Athabascans
93.4%
11TH GRADE
98.1/ 100
METRIC RATING
111th/ 347
METRIC RANK
93.9%
11TH GRADE
99.8/ 100
METRIC RATING
66th/ 347
METRIC RANK
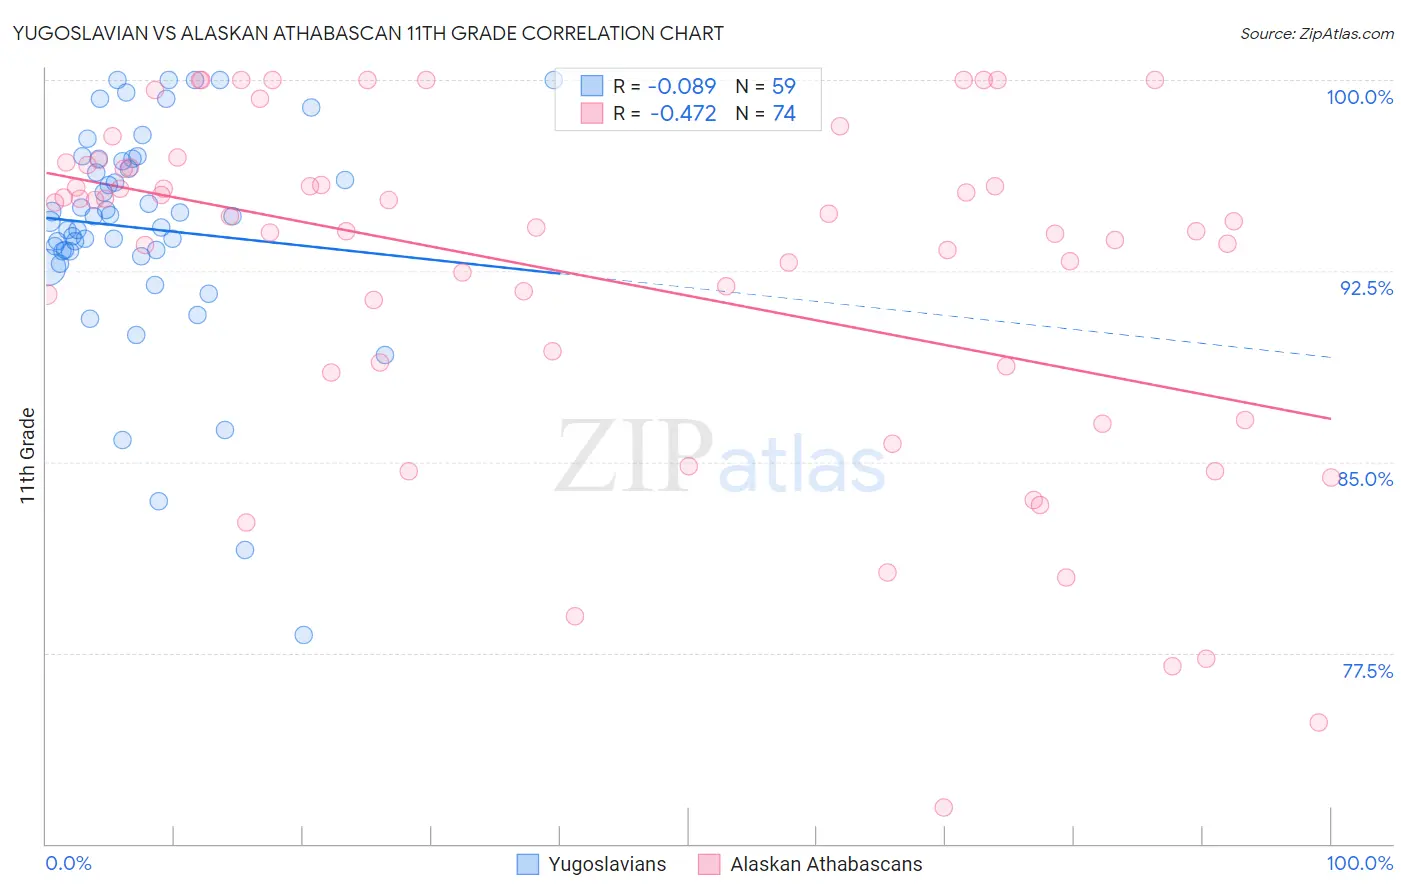
Yugoslavian vs Alaskan Athabascan 11th Grade Correlation Chart
The statistical analysis conducted on geographies consisting of 285,719,638 people shows a slight negative correlation between the proportion of Yugoslavians and percentage of population with at least 11th grade education in the United States with a correlation coefficient (R) of -0.089 and weighted average of 93.4%. Similarly, the statistical analysis conducted on geographies consisting of 45,820,226 people shows a moderate negative correlation between the proportion of Alaskan Athabascans and percentage of population with at least 11th grade education in the United States with a correlation coefficient (R) of -0.472 and weighted average of 93.9%, a difference of 0.54%.
11th Grade Correlation Summary
| Measurement | Yugoslavian | Alaskan Athabascan |
| Minimum | 78.2% | 71.4% |
| Maximum | 100.0% | 100.0% |
| Range | 21.8% | 28.6% |
| Mean | 94.2% | 92.3% |
| Median | 94.7% | 94.3% |
| Interquartile 25% (IQ1) | 93.3% | 88.7% |
| Interquartile 75% (IQ3) | 96.9% | 96.5% |
| Interquartile Range (IQR) | 3.7% | 7.8% |
| Standard Deviation (Sample) | 4.4% | 6.8% |
| Standard Deviation (Population) | 4.3% | 6.7% |
Similar Demographics by 11th Grade
Demographics Similar to Yugoslavians by 11th Grade
In terms of 11th grade, the demographic groups most similar to Yugoslavians are Immigrants from Germany (93.4%, a difference of 0.010%), Immigrants from Zimbabwe (93.4%, a difference of 0.030%), Syrian (93.4%, a difference of 0.040%), Jordanian (93.4%, a difference of 0.040%), and Immigrants from Norway (93.5%, a difference of 0.050%).
| Demographics | Rating | Rank | 11th Grade |
| Immigrants | Europe | 98.6 /100 | #104 | Exceptional 93.5% |
| Immigrants | Serbia | 98.6 /100 | #105 | Exceptional 93.5% |
| Immigrants | Croatia | 98.6 /100 | #106 | Exceptional 93.5% |
| Immigrants | Norway | 98.4 /100 | #107 | Exceptional 93.5% |
| Alaska Natives | 98.4 /100 | #108 | Exceptional 93.5% |
| Immigrants | Kuwait | 98.4 /100 | #109 | Exceptional 93.5% |
| Syrians | 98.4 /100 | #110 | Exceptional 93.4% |
| Yugoslavians | 98.1 /100 | #111 | Exceptional 93.4% |
| Immigrants | Germany | 98.0 /100 | #112 | Exceptional 93.4% |
| Immigrants | Zimbabwe | 97.8 /100 | #113 | Exceptional 93.4% |
| Jordanians | 97.8 /100 | #114 | Exceptional 93.4% |
| Palestinians | 97.7 /100 | #115 | Exceptional 93.4% |
| Immigrants | Hungary | 97.5 /100 | #116 | Exceptional 93.4% |
| Whites/Caucasians | 97.4 /100 | #117 | Exceptional 93.3% |
| Immigrants | Korea | 97.0 /100 | #118 | Exceptional 93.3% |
Demographics Similar to Alaskan Athabascans by 11th Grade
In terms of 11th grade, the demographic groups most similar to Alaskan Athabascans are Immigrants from Netherlands (93.9%, a difference of 0.0%), Immigrants from Sweden (93.9%, a difference of 0.020%), Native Hawaiian (93.9%, a difference of 0.020%), Zimbabwean (93.9%, a difference of 0.020%), and Scotch-Irish (93.9%, a difference of 0.020%).
| Demographics | Rating | Rank | 11th Grade |
| Bhutanese | 99.8 /100 | #59 | Exceptional 94.0% |
| Okinawans | 99.8 /100 | #60 | Exceptional 94.0% |
| Immigrants | Belgium | 99.8 /100 | #61 | Exceptional 94.0% |
| Austrians | 99.8 /100 | #62 | Exceptional 94.0% |
| Ukrainians | 99.8 /100 | #63 | Exceptional 94.0% |
| Immigrants | Sweden | 99.8 /100 | #64 | Exceptional 93.9% |
| Native Hawaiians | 99.8 /100 | #65 | Exceptional 93.9% |
| Alaskan Athabascans | 99.8 /100 | #66 | Exceptional 93.9% |
| Immigrants | Netherlands | 99.8 /100 | #67 | Exceptional 93.9% |
| Zimbabweans | 99.8 /100 | #68 | Exceptional 93.9% |
| Scotch-Irish | 99.8 /100 | #69 | Exceptional 93.9% |
| Immigrants | England | 99.7 /100 | #70 | Exceptional 93.8% |
| Immigrants | South Africa | 99.7 /100 | #71 | Exceptional 93.8% |
| Immigrants | Japan | 99.7 /100 | #72 | Exceptional 93.8% |
| Romanians | 99.6 /100 | #73 | Exceptional 93.8% |