Yugoslavian vs Immigrants from Malaysia 11th Grade
COMPARE
Yugoslavian
Immigrants from Malaysia
11th Grade
11th Grade Comparison
Yugoslavians
Immigrants from Malaysia
93.4%
11TH GRADE
98.1/ 100
METRIC RATING
111th/ 347
METRIC RANK
92.4%
11TH GRADE
37.6/ 100
METRIC RATING
183rd/ 347
METRIC RANK
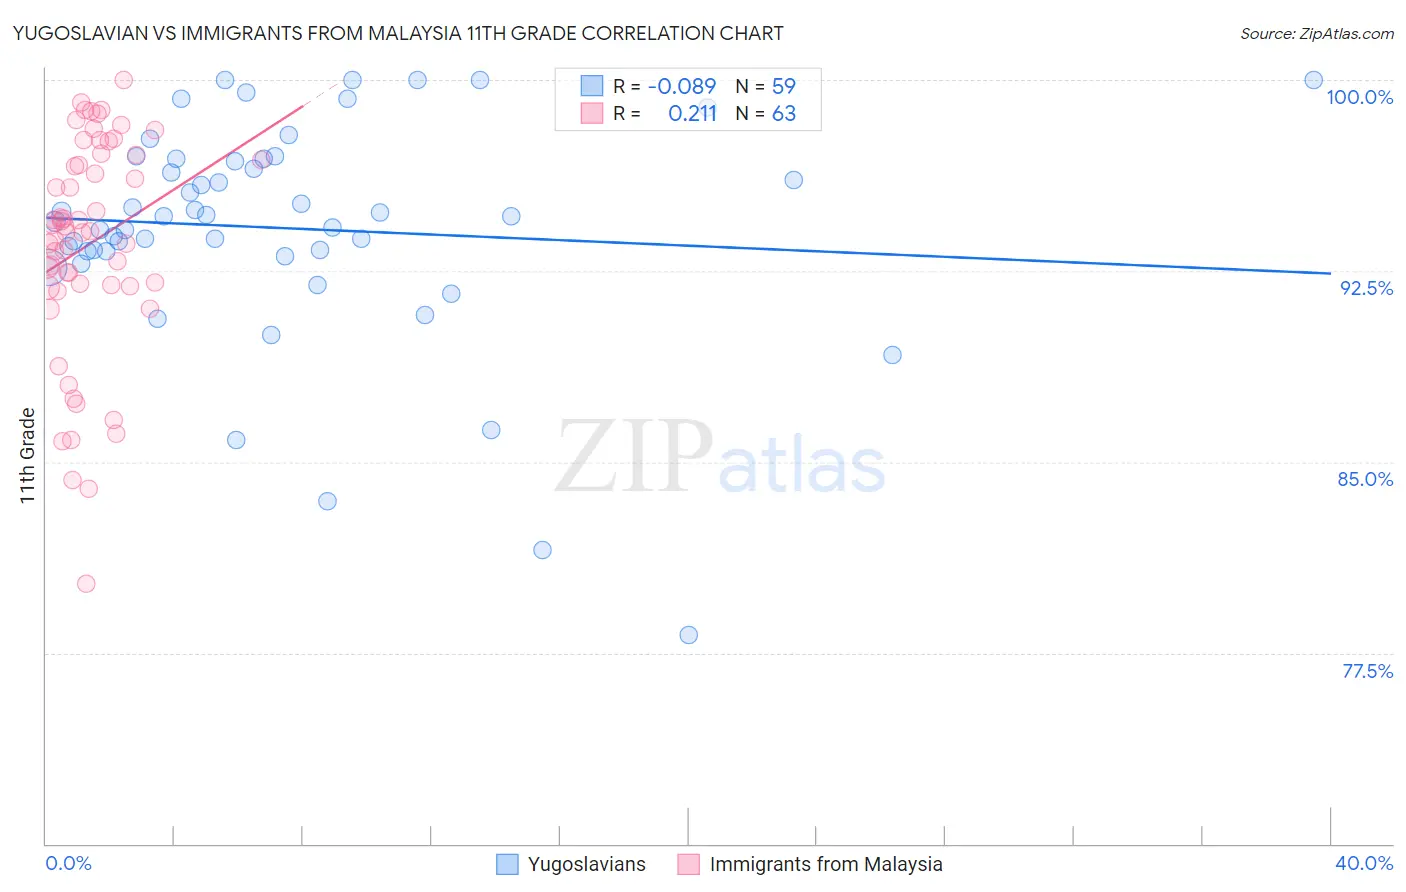
Yugoslavian vs Immigrants from Malaysia 11th Grade Correlation Chart
The statistical analysis conducted on geographies consisting of 285,719,638 people shows a slight negative correlation between the proportion of Yugoslavians and percentage of population with at least 11th grade education in the United States with a correlation coefficient (R) of -0.089 and weighted average of 93.4%. Similarly, the statistical analysis conducted on geographies consisting of 197,973,709 people shows a weak positive correlation between the proportion of Immigrants from Malaysia and percentage of population with at least 11th grade education in the United States with a correlation coefficient (R) of 0.211 and weighted average of 92.4%, a difference of 1.1%.
11th Grade Correlation Summary
| Measurement | Yugoslavian | Immigrants from Malaysia |
| Minimum | 78.2% | 80.2% |
| Maximum | 100.0% | 100.0% |
| Range | 21.8% | 19.8% |
| Mean | 94.2% | 93.5% |
| Median | 94.7% | 94.0% |
| Interquartile 25% (IQ1) | 93.3% | 91.9% |
| Interquartile 75% (IQ3) | 96.9% | 97.0% |
| Interquartile Range (IQR) | 3.7% | 5.1% |
| Standard Deviation (Sample) | 4.4% | 4.3% |
| Standard Deviation (Population) | 4.3% | 4.3% |
Similar Demographics by 11th Grade
Demographics Similar to Yugoslavians by 11th Grade
In terms of 11th grade, the demographic groups most similar to Yugoslavians are Immigrants from Germany (93.4%, a difference of 0.010%), Immigrants from Zimbabwe (93.4%, a difference of 0.030%), Syrian (93.4%, a difference of 0.040%), Jordanian (93.4%, a difference of 0.040%), and Immigrants from Norway (93.5%, a difference of 0.050%).
| Demographics | Rating | Rank | 11th Grade |
| Immigrants | Europe | 98.6 /100 | #104 | Exceptional 93.5% |
| Immigrants | Serbia | 98.6 /100 | #105 | Exceptional 93.5% |
| Immigrants | Croatia | 98.6 /100 | #106 | Exceptional 93.5% |
| Immigrants | Norway | 98.4 /100 | #107 | Exceptional 93.5% |
| Alaska Natives | 98.4 /100 | #108 | Exceptional 93.5% |
| Immigrants | Kuwait | 98.4 /100 | #109 | Exceptional 93.5% |
| Syrians | 98.4 /100 | #110 | Exceptional 93.4% |
| Yugoslavians | 98.1 /100 | #111 | Exceptional 93.4% |
| Immigrants | Germany | 98.0 /100 | #112 | Exceptional 93.4% |
| Immigrants | Zimbabwe | 97.8 /100 | #113 | Exceptional 93.4% |
| Jordanians | 97.8 /100 | #114 | Exceptional 93.4% |
| Palestinians | 97.7 /100 | #115 | Exceptional 93.4% |
| Immigrants | Hungary | 97.5 /100 | #116 | Exceptional 93.4% |
| Whites/Caucasians | 97.4 /100 | #117 | Exceptional 93.3% |
| Immigrants | Korea | 97.0 /100 | #118 | Exceptional 93.3% |
Demographics Similar to Immigrants from Malaysia by 11th Grade
In terms of 11th grade, the demographic groups most similar to Immigrants from Malaysia are Immigrants from Asia (92.4%, a difference of 0.0%), Immigrants from Morocco (92.4%, a difference of 0.010%), Immigrants from Nepal (92.4%, a difference of 0.010%), Creek (92.4%, a difference of 0.030%), and Inupiat (92.4%, a difference of 0.030%).
| Demographics | Rating | Rank | 11th Grade |
| Spaniards | 46.9 /100 | #176 | Average 92.5% |
| Guamanians/Chamorros | 45.0 /100 | #177 | Average 92.5% |
| Sudanese | 43.4 /100 | #178 | Average 92.5% |
| Creek | 40.9 /100 | #179 | Average 92.4% |
| Inupiat | 40.7 /100 | #180 | Average 92.4% |
| Cherokee | 40.7 /100 | #181 | Average 92.4% |
| Immigrants | Morocco | 38.6 /100 | #182 | Fair 92.4% |
| Immigrants | Malaysia | 37.6 /100 | #183 | Fair 92.4% |
| Immigrants | Asia | 37.4 /100 | #184 | Fair 92.4% |
| Immigrants | Nepal | 36.4 /100 | #185 | Fair 92.4% |
| Arapaho | 35.1 /100 | #186 | Fair 92.4% |
| Immigrants | Western Asia | 35.0 /100 | #187 | Fair 92.4% |
| Immigrants | Indonesia | 33.7 /100 | #188 | Fair 92.4% |
| Immigrants | Chile | 33.3 /100 | #189 | Fair 92.4% |
| Chickasaw | 31.4 /100 | #190 | Fair 92.3% |