Yugoslavian vs Yakama 11th Grade
COMPARE
Yugoslavian
Yakama
11th Grade
11th Grade Comparison
Yugoslavians
Yakama
93.4%
11TH GRADE
98.1/ 100
METRIC RATING
111th/ 347
METRIC RANK
85.0%
11TH GRADE
0.0/ 100
METRIC RATING
344th/ 347
METRIC RANK
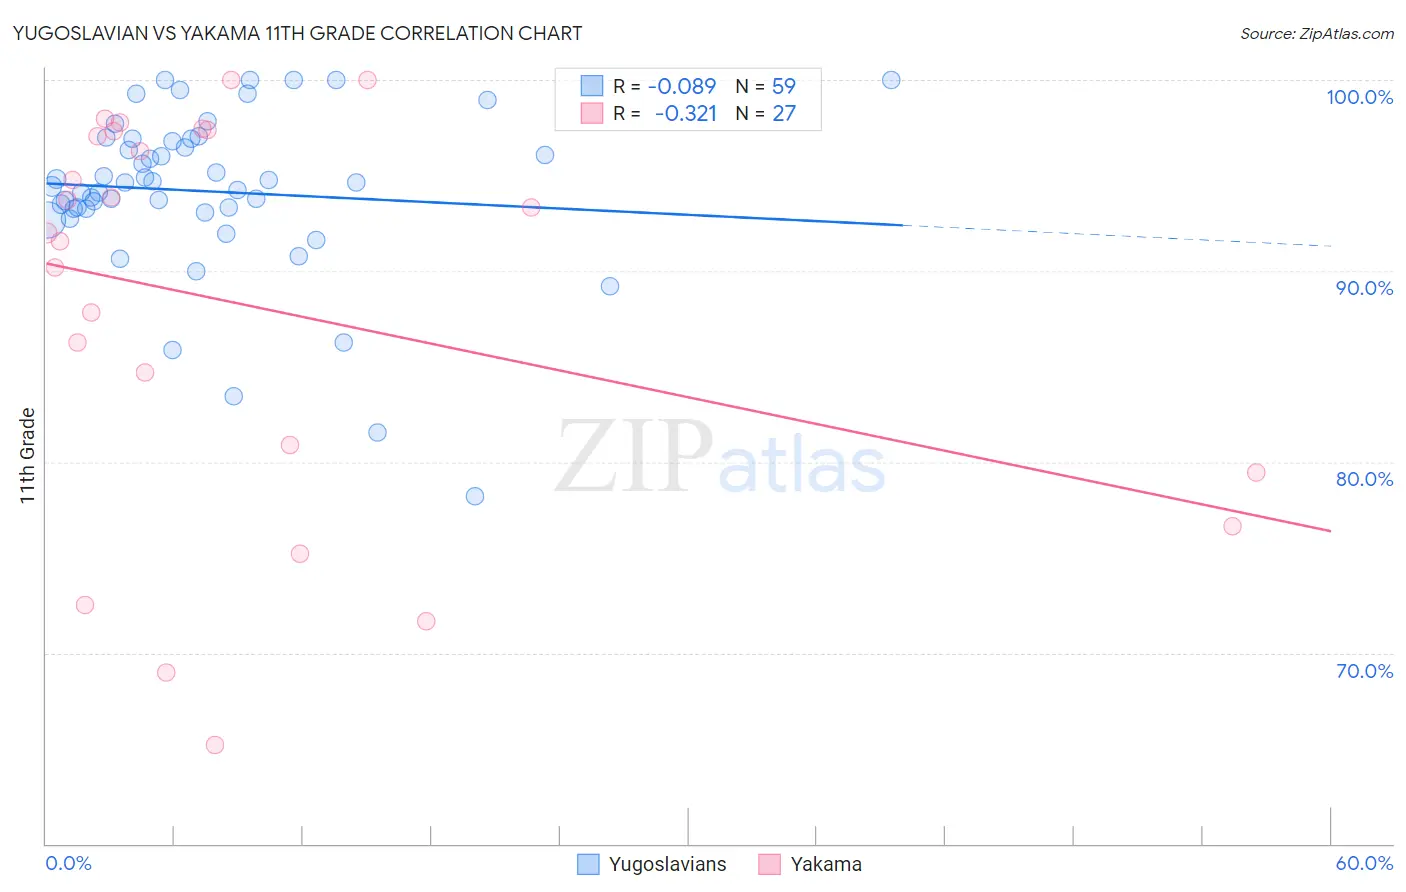
Yugoslavian vs Yakama 11th Grade Correlation Chart
The statistical analysis conducted on geographies consisting of 285,719,638 people shows a slight negative correlation between the proportion of Yugoslavians and percentage of population with at least 11th grade education in the United States with a correlation coefficient (R) of -0.089 and weighted average of 93.4%. Similarly, the statistical analysis conducted on geographies consisting of 19,923,144 people shows a mild negative correlation between the proportion of Yakama and percentage of population with at least 11th grade education in the United States with a correlation coefficient (R) of -0.321 and weighted average of 85.0%, a difference of 9.9%.
11th Grade Correlation Summary
| Measurement | Yugoslavian | Yakama |
| Minimum | 78.2% | 65.2% |
| Maximum | 100.0% | 100.0% |
| Range | 21.8% | 34.8% |
| Mean | 94.2% | 88.1% |
| Median | 94.7% | 92.0% |
| Interquartile 25% (IQ1) | 93.3% | 79.5% |
| Interquartile 75% (IQ3) | 96.9% | 97.3% |
| Interquartile Range (IQR) | 3.7% | 17.9% |
| Standard Deviation (Sample) | 4.4% | 10.5% |
| Standard Deviation (Population) | 4.3% | 10.3% |
Similar Demographics by 11th Grade
Demographics Similar to Yugoslavians by 11th Grade
In terms of 11th grade, the demographic groups most similar to Yugoslavians are Immigrants from Germany (93.4%, a difference of 0.010%), Immigrants from Zimbabwe (93.4%, a difference of 0.030%), Syrian (93.4%, a difference of 0.040%), Jordanian (93.4%, a difference of 0.040%), and Immigrants from Norway (93.5%, a difference of 0.050%).
| Demographics | Rating | Rank | 11th Grade |
| Immigrants | Europe | 98.6 /100 | #104 | Exceptional 93.5% |
| Immigrants | Serbia | 98.6 /100 | #105 | Exceptional 93.5% |
| Immigrants | Croatia | 98.6 /100 | #106 | Exceptional 93.5% |
| Immigrants | Norway | 98.4 /100 | #107 | Exceptional 93.5% |
| Alaska Natives | 98.4 /100 | #108 | Exceptional 93.5% |
| Immigrants | Kuwait | 98.4 /100 | #109 | Exceptional 93.5% |
| Syrians | 98.4 /100 | #110 | Exceptional 93.4% |
| Yugoslavians | 98.1 /100 | #111 | Exceptional 93.4% |
| Immigrants | Germany | 98.0 /100 | #112 | Exceptional 93.4% |
| Immigrants | Zimbabwe | 97.8 /100 | #113 | Exceptional 93.4% |
| Jordanians | 97.8 /100 | #114 | Exceptional 93.4% |
| Palestinians | 97.7 /100 | #115 | Exceptional 93.4% |
| Immigrants | Hungary | 97.5 /100 | #116 | Exceptional 93.4% |
| Whites/Caucasians | 97.4 /100 | #117 | Exceptional 93.3% |
| Immigrants | Korea | 97.0 /100 | #118 | Exceptional 93.3% |
Demographics Similar to Yakama by 11th Grade
In terms of 11th grade, the demographic groups most similar to Yakama are Immigrants from Central America (84.9%, a difference of 0.030%), Spanish American Indian (84.7%, a difference of 0.27%), Immigrants from El Salvador (85.3%, a difference of 0.40%), Immigrants from Mexico (84.5%, a difference of 0.57%), and Immigrants from Guatemala (85.8%, a difference of 1.0%).
| Demographics | Rating | Rank | 11th Grade |
| Immigrants | Yemen | 0.0 /100 | #333 | Tragic 87.1% |
| Houma | 0.0 /100 | #334 | Tragic 87.0% |
| Central Americans | 0.0 /100 | #335 | Tragic 86.9% |
| Immigrants | Dominican Republic | 0.0 /100 | #336 | Tragic 86.9% |
| Immigrants | Honduras | 0.0 /100 | #337 | Tragic 86.9% |
| Immigrants | Latin America | 0.0 /100 | #338 | Tragic 86.8% |
| Guatemalans | 0.0 /100 | #339 | Tragic 86.4% |
| Salvadorans | 0.0 /100 | #340 | Tragic 86.2% |
| Mexicans | 0.0 /100 | #341 | Tragic 86.1% |
| Immigrants | Guatemala | 0.0 /100 | #342 | Tragic 85.8% |
| Immigrants | El Salvador | 0.0 /100 | #343 | Tragic 85.3% |
| Yakama | 0.0 /100 | #344 | Tragic 85.0% |
| Immigrants | Central America | 0.0 /100 | #345 | Tragic 84.9% |
| Spanish American Indians | 0.0 /100 | #346 | Tragic 84.7% |
| Immigrants | Mexico | 0.0 /100 | #347 | Tragic 84.5% |