Yugoslavian vs Colombian 1st Grade
COMPARE
Yugoslavian
Colombian
1st Grade
1st Grade Comparison
Yugoslavians
Colombians
98.2%
1ST GRADE
95.5/ 100
METRIC RATING
117th/ 347
METRIC RANK
97.6%
1ST GRADE
2.2/ 100
METRIC RATING
234th/ 347
METRIC RANK
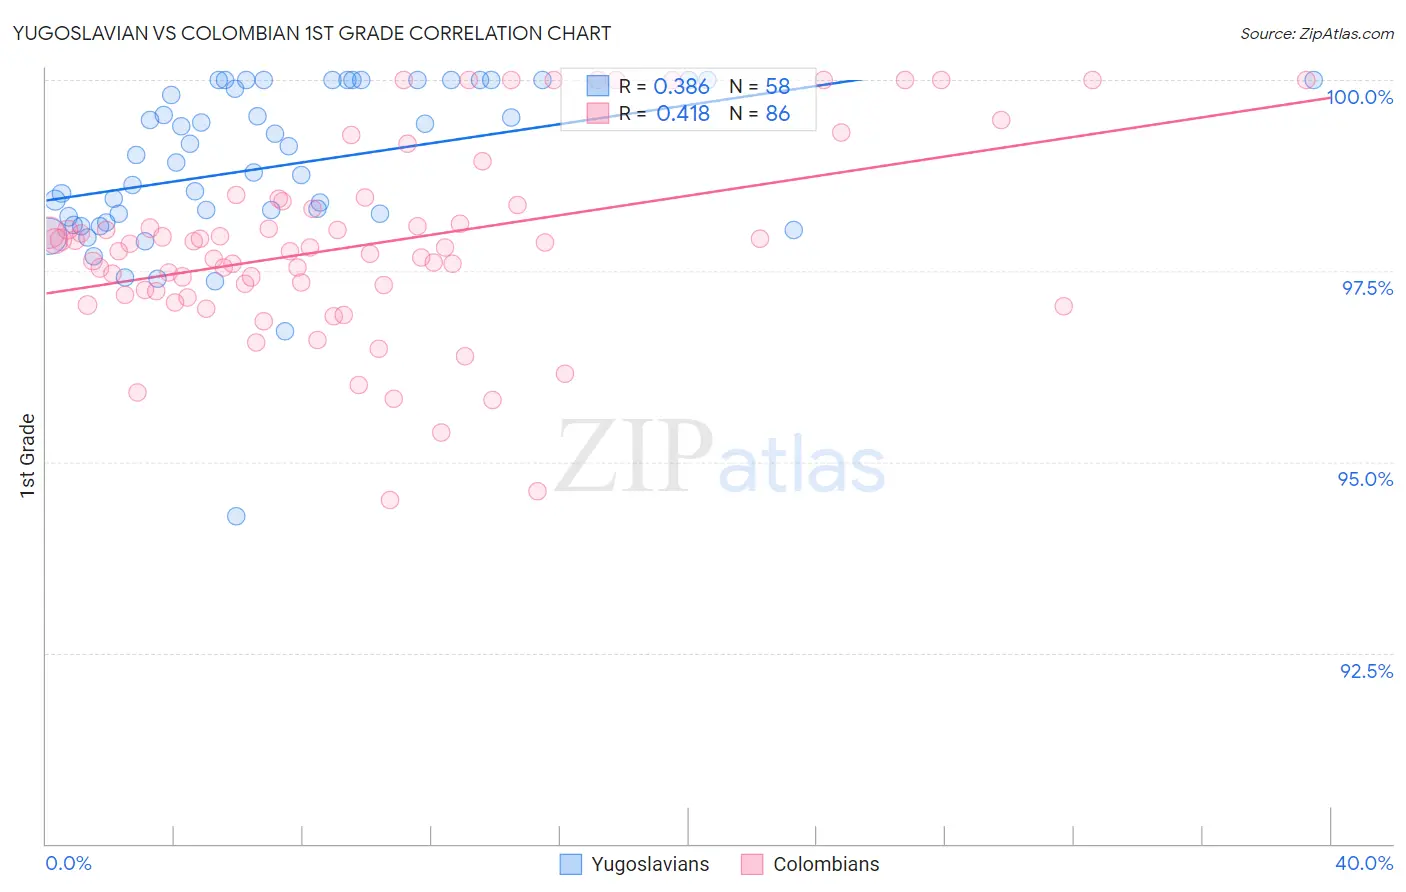
Yugoslavian vs Colombian 1st Grade Correlation Chart
The statistical analysis conducted on geographies consisting of 285,681,276 people shows a mild positive correlation between the proportion of Yugoslavians and percentage of population with at least 1st grade education in the United States with a correlation coefficient (R) of 0.386 and weighted average of 98.2%. Similarly, the statistical analysis conducted on geographies consisting of 419,700,680 people shows a moderate positive correlation between the proportion of Colombians and percentage of population with at least 1st grade education in the United States with a correlation coefficient (R) of 0.418 and weighted average of 97.6%, a difference of 0.53%.
1st Grade Correlation Summary
| Measurement | Yugoslavian | Colombian |
| Minimum | 94.3% | 94.5% |
| Maximum | 100.0% | 100.0% |
| Range | 5.7% | 5.5% |
| Mean | 98.9% | 97.8% |
| Median | 99.0% | 97.8% |
| Interquartile 25% (IQ1) | 98.2% | 97.2% |
| Interquartile 75% (IQ3) | 100.0% | 98.4% |
| Interquartile Range (IQR) | 1.8% | 1.1% |
| Standard Deviation (Sample) | 1.1% | 1.2% |
| Standard Deviation (Population) | 1.1% | 1.2% |
Similar Demographics by 1st Grade
Demographics Similar to Yugoslavians by 1st Grade
In terms of 1st grade, the demographic groups most similar to Yugoslavians are Immigrants from France (98.2%, a difference of 0.0%), Ute (98.2%, a difference of 0.010%), Iranian (98.2%, a difference of 0.010%), Spanish (98.2%, a difference of 0.010%), and Thai (98.1%, a difference of 0.010%).
| Demographics | Rating | Rank | 1st Grade |
| Immigrants | Singapore | 96.7 /100 | #110 | Exceptional 98.2% |
| Immigrants | Czechoslovakia | 96.6 /100 | #111 | Exceptional 98.2% |
| Immigrants | Norway | 96.6 /100 | #112 | Exceptional 98.2% |
| Immigrants | Latvia | 96.4 /100 | #113 | Exceptional 98.2% |
| Ute | 96.2 /100 | #114 | Exceptional 98.2% |
| Iranians | 96.0 /100 | #115 | Exceptional 98.2% |
| Spanish | 95.9 /100 | #116 | Exceptional 98.2% |
| Yugoslavians | 95.5 /100 | #117 | Exceptional 98.2% |
| Immigrants | France | 95.5 /100 | #118 | Exceptional 98.2% |
| Thais | 94.7 /100 | #119 | Exceptional 98.1% |
| Okinawans | 94.5 /100 | #120 | Exceptional 98.1% |
| Immigrants | Zimbabwe | 94.0 /100 | #121 | Exceptional 98.1% |
| Menominee | 93.9 /100 | #122 | Exceptional 98.1% |
| Iroquois | 93.8 /100 | #123 | Exceptional 98.1% |
| Syrians | 93.7 /100 | #124 | Exceptional 98.1% |
Demographics Similar to Colombians by 1st Grade
In terms of 1st grade, the demographic groups most similar to Colombians are Immigrants from Pakistan (97.6%, a difference of 0.0%), Immigrants from Malaysia (97.6%, a difference of 0.0%), Immigrants from Western Asia (97.6%, a difference of 0.0%), Immigrants from Uruguay (97.6%, a difference of 0.010%), and U.S. Virgin Islander (97.6%, a difference of 0.010%).
| Demographics | Rating | Rank | 1st Grade |
| Sierra Leoneans | 3.6 /100 | #227 | Tragic 97.7% |
| Sub-Saharan Africans | 3.6 /100 | #228 | Tragic 97.7% |
| Immigrants | Costa Rica | 3.5 /100 | #229 | Tragic 97.7% |
| Senegalese | 3.5 /100 | #230 | Tragic 97.7% |
| Puerto Ricans | 3.0 /100 | #231 | Tragic 97.7% |
| Immigrants | Uruguay | 2.5 /100 | #232 | Tragic 97.6% |
| Immigrants | Pakistan | 2.2 /100 | #233 | Tragic 97.6% |
| Colombians | 2.2 /100 | #234 | Tragic 97.6% |
| Immigrants | Malaysia | 2.1 /100 | #235 | Tragic 97.6% |
| Immigrants | Western Asia | 2.1 /100 | #236 | Tragic 97.6% |
| U.S. Virgin Islanders | 1.9 /100 | #237 | Tragic 97.6% |
| Nigerians | 1.8 /100 | #238 | Tragic 97.6% |
| Immigrants | Eastern Asia | 1.6 /100 | #239 | Tragic 97.6% |
| Koreans | 1.5 /100 | #240 | Tragic 97.6% |
| Liberians | 1.4 /100 | #241 | Tragic 97.6% |