Yugoslavian vs Colombian Master's Degree
COMPARE
Yugoslavian
Colombian
Master's Degree
Master's Degree Comparison
Yugoslavians
Colombians
14.4%
MASTER'S DEGREE
24.3/ 100
METRIC RATING
203rd/ 347
METRIC RANK
15.3%
MASTER'S DEGREE
66.9/ 100
METRIC RATING
164th/ 347
METRIC RANK
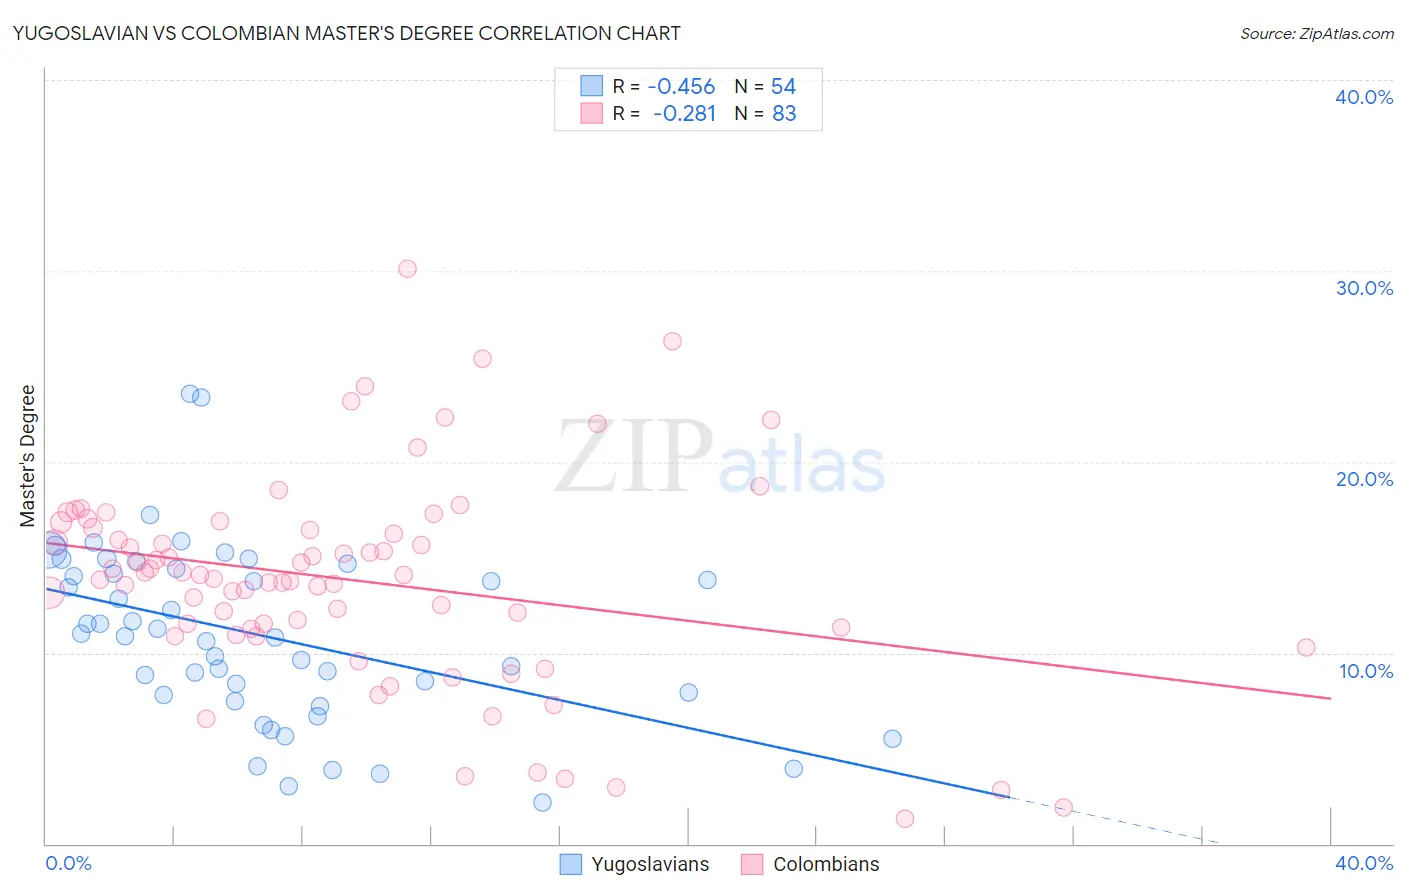
Yugoslavian vs Colombian Master's Degree Correlation Chart
The statistical analysis conducted on geographies consisting of 285,661,106 people shows a moderate negative correlation between the proportion of Yugoslavians and percentage of population with at least master's degree education in the United States with a correlation coefficient (R) of -0.456 and weighted average of 14.4%. Similarly, the statistical analysis conducted on geographies consisting of 419,504,148 people shows a weak negative correlation between the proportion of Colombians and percentage of population with at least master's degree education in the United States with a correlation coefficient (R) of -0.281 and weighted average of 15.3%, a difference of 6.1%.
Master's Degree Correlation Summary
| Measurement | Yugoslavian | Colombian |
| Minimum | 2.2% | 1.3% |
| Maximum | 23.6% | 30.1% |
| Range | 21.4% | 28.8% |
| Mean | 10.9% | 13.8% |
| Median | 10.9% | 14.1% |
| Interquartile 25% (IQ1) | 7.8% | 11.3% |
| Interquartile 75% (IQ3) | 14.4% | 16.5% |
| Interquartile Range (IQR) | 6.6% | 5.3% |
| Standard Deviation (Sample) | 4.7% | 5.5% |
| Standard Deviation (Population) | 4.6% | 5.4% |
Similar Demographics by Master's Degree
Demographics Similar to Yugoslavians by Master's Degree
In terms of master's degree, the demographic groups most similar to Yugoslavians are Immigrants from Western Africa (14.4%, a difference of 0.11%), French (14.4%, a difference of 0.11%), Panamanian (14.4%, a difference of 0.13%), Scotch-Irish (14.4%, a difference of 0.13%), and Trinidadian and Tobagonian (14.4%, a difference of 0.15%).
| Demographics | Rating | Rank | Master's Degree |
| Czechoslovakians | 29.9 /100 | #196 | Fair 14.5% |
| Belgians | 28.0 /100 | #197 | Fair 14.5% |
| West Indians | 27.4 /100 | #198 | Fair 14.5% |
| Immigrants | Armenia | 27.2 /100 | #199 | Fair 14.5% |
| Panamanians | 25.1 /100 | #200 | Fair 14.4% |
| Scotch-Irish | 25.0 /100 | #201 | Fair 14.4% |
| Immigrants | Western Africa | 24.9 /100 | #202 | Fair 14.4% |
| Yugoslavians | 24.3 /100 | #203 | Fair 14.4% |
| French | 23.7 /100 | #204 | Fair 14.4% |
| Trinidadians and Tobagonians | 23.5 /100 | #205 | Fair 14.4% |
| Scandinavians | 23.3 /100 | #206 | Fair 14.4% |
| Immigrants | Bosnia and Herzegovina | 22.0 /100 | #207 | Fair 14.3% |
| Immigrants | Barbados | 20.5 /100 | #208 | Fair 14.3% |
| Immigrants | Panama | 20.0 /100 | #209 | Fair 14.3% |
| Sub-Saharan Africans | 19.4 /100 | #210 | Poor 14.2% |
Demographics Similar to Colombians by Master's Degree
In terms of master's degree, the demographic groups most similar to Colombians are Uruguayan (15.3%, a difference of 0.030%), Immigrants from Kenya (15.3%, a difference of 0.040%), Swedish (15.2%, a difference of 0.11%), Senegalese (15.2%, a difference of 0.19%), and Peruvian (15.3%, a difference of 0.25%).
| Demographics | Rating | Rank | Master's Degree |
| Immigrants | Cameroon | 71.7 /100 | #157 | Good 15.4% |
| Immigrants | Poland | 71.5 /100 | #158 | Good 15.4% |
| Luxembourgers | 71.0 /100 | #159 | Good 15.3% |
| Kenyans | 70.3 /100 | #160 | Good 15.3% |
| Sudanese | 68.7 /100 | #161 | Good 15.3% |
| Peruvians | 68.7 /100 | #162 | Good 15.3% |
| Uruguayans | 67.1 /100 | #163 | Good 15.3% |
| Colombians | 66.9 /100 | #164 | Good 15.3% |
| Immigrants | Kenya | 66.6 /100 | #165 | Good 15.3% |
| Swedes | 66.1 /100 | #166 | Good 15.2% |
| Senegalese | 65.6 /100 | #167 | Good 15.2% |
| Immigrants | North Macedonia | 64.5 /100 | #168 | Good 15.2% |
| Scottish | 62.7 /100 | #169 | Good 15.2% |
| Irish | 56.3 /100 | #170 | Average 15.0% |
| Immigrants | Ghana | 53.6 /100 | #171 | Average 15.0% |