Immigrants from Serbia vs Colombian 1st Grade
COMPARE
Immigrants from Serbia
Colombian
1st Grade
1st Grade Comparison
Immigrants from Serbia
Colombians
98.1%
1ST GRADE
92.2/ 100
METRIC RATING
128th/ 347
METRIC RANK
97.6%
1ST GRADE
2.2/ 100
METRIC RATING
234th/ 347
METRIC RANK
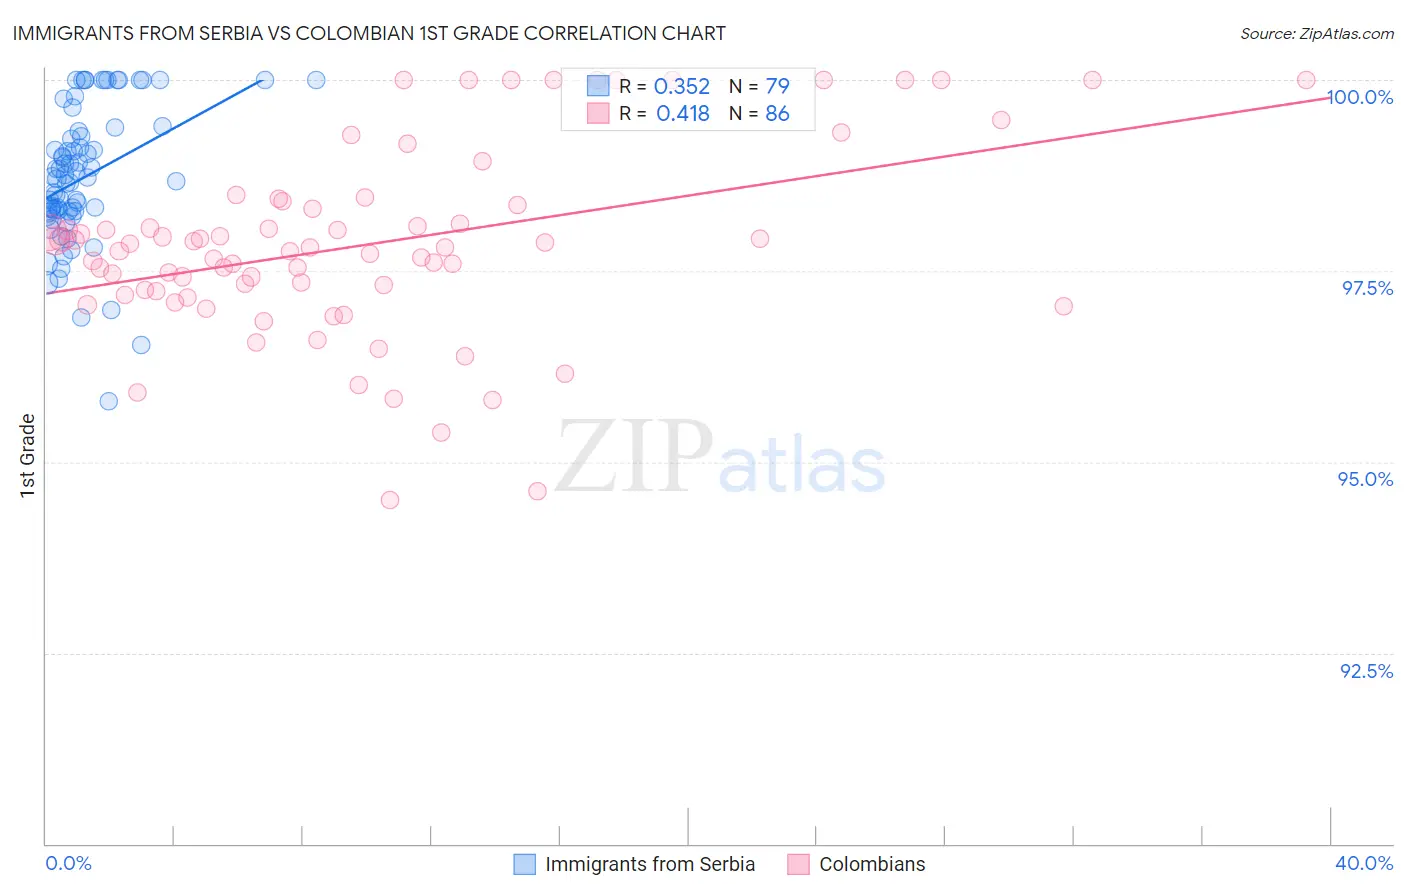
Immigrants from Serbia vs Colombian 1st Grade Correlation Chart
The statistical analysis conducted on geographies consisting of 131,729,423 people shows a mild positive correlation between the proportion of Immigrants from Serbia and percentage of population with at least 1st grade education in the United States with a correlation coefficient (R) of 0.352 and weighted average of 98.1%. Similarly, the statistical analysis conducted on geographies consisting of 419,700,680 people shows a moderate positive correlation between the proportion of Colombians and percentage of population with at least 1st grade education in the United States with a correlation coefficient (R) of 0.418 and weighted average of 97.6%, a difference of 0.49%.
1st Grade Correlation Summary
| Measurement | Immigrants from Serbia | Colombian |
| Minimum | 95.8% | 94.5% |
| Maximum | 100.0% | 100.0% |
| Range | 4.2% | 5.5% |
| Mean | 98.7% | 97.8% |
| Median | 98.7% | 97.8% |
| Interquartile 25% (IQ1) | 98.3% | 97.2% |
| Interquartile 75% (IQ3) | 99.3% | 98.4% |
| Interquartile Range (IQR) | 1.0% | 1.1% |
| Standard Deviation (Sample) | 0.90% | 1.2% |
| Standard Deviation (Population) | 0.89% | 1.2% |
Similar Demographics by 1st Grade
Demographics Similar to Immigrants from Serbia by 1st Grade
In terms of 1st grade, the demographic groups most similar to Immigrants from Serbia are Seminole (98.1%, a difference of 0.0%), Immigrants from Saudi Arabia (98.1%, a difference of 0.010%), Immigrants from Croatia (98.1%, a difference of 0.010%), Spaniard (98.1%, a difference of 0.010%), and Cambodian (98.1%, a difference of 0.010%).
| Demographics | Rating | Rank | 1st Grade |
| Immigrants | Zimbabwe | 94.0 /100 | #121 | Exceptional 98.1% |
| Menominee | 93.9 /100 | #122 | Exceptional 98.1% |
| Iroquois | 93.8 /100 | #123 | Exceptional 98.1% |
| Syrians | 93.7 /100 | #124 | Exceptional 98.1% |
| Immigrants | Japan | 93.7 /100 | #125 | Exceptional 98.1% |
| Lebanese | 93.5 /100 | #126 | Exceptional 98.1% |
| Immigrants | Saudi Arabia | 93.3 /100 | #127 | Exceptional 98.1% |
| Immigrants | Serbia | 92.2 /100 | #128 | Exceptional 98.1% |
| Seminole | 91.9 /100 | #129 | Exceptional 98.1% |
| Immigrants | Croatia | 91.4 /100 | #130 | Exceptional 98.1% |
| Spaniards | 91.2 /100 | #131 | Exceptional 98.1% |
| Cambodians | 90.9 /100 | #132 | Exceptional 98.1% |
| Immigrants | Europe | 90.5 /100 | #133 | Exceptional 98.1% |
| Immigrants | Hungary | 89.4 /100 | #134 | Excellent 98.1% |
| Immigrants | Kuwait | 89.3 /100 | #135 | Excellent 98.1% |
Demographics Similar to Colombians by 1st Grade
In terms of 1st grade, the demographic groups most similar to Colombians are Immigrants from Pakistan (97.6%, a difference of 0.0%), Immigrants from Malaysia (97.6%, a difference of 0.0%), Immigrants from Western Asia (97.6%, a difference of 0.0%), Immigrants from Uruguay (97.6%, a difference of 0.010%), and U.S. Virgin Islander (97.6%, a difference of 0.010%).
| Demographics | Rating | Rank | 1st Grade |
| Sierra Leoneans | 3.6 /100 | #227 | Tragic 97.7% |
| Sub-Saharan Africans | 3.6 /100 | #228 | Tragic 97.7% |
| Immigrants | Costa Rica | 3.5 /100 | #229 | Tragic 97.7% |
| Senegalese | 3.5 /100 | #230 | Tragic 97.7% |
| Puerto Ricans | 3.0 /100 | #231 | Tragic 97.7% |
| Immigrants | Uruguay | 2.5 /100 | #232 | Tragic 97.6% |
| Immigrants | Pakistan | 2.2 /100 | #233 | Tragic 97.6% |
| Colombians | 2.2 /100 | #234 | Tragic 97.6% |
| Immigrants | Malaysia | 2.1 /100 | #235 | Tragic 97.6% |
| Immigrants | Western Asia | 2.1 /100 | #236 | Tragic 97.6% |
| U.S. Virgin Islanders | 1.9 /100 | #237 | Tragic 97.6% |
| Nigerians | 1.8 /100 | #238 | Tragic 97.6% |
| Immigrants | Eastern Asia | 1.6 /100 | #239 | Tragic 97.6% |
| Koreans | 1.5 /100 | #240 | Tragic 97.6% |
| Liberians | 1.4 /100 | #241 | Tragic 97.6% |