Immigrants from Armenia vs Colombian 1st Grade
COMPARE
Immigrants from Armenia
Colombian
1st Grade
1st Grade Comparison
Immigrants from Armenia
Colombians
96.6%
1ST GRADE
0.0/ 100
METRIC RATING
331st/ 347
METRIC RANK
97.6%
1ST GRADE
2.2/ 100
METRIC RATING
234th/ 347
METRIC RANK
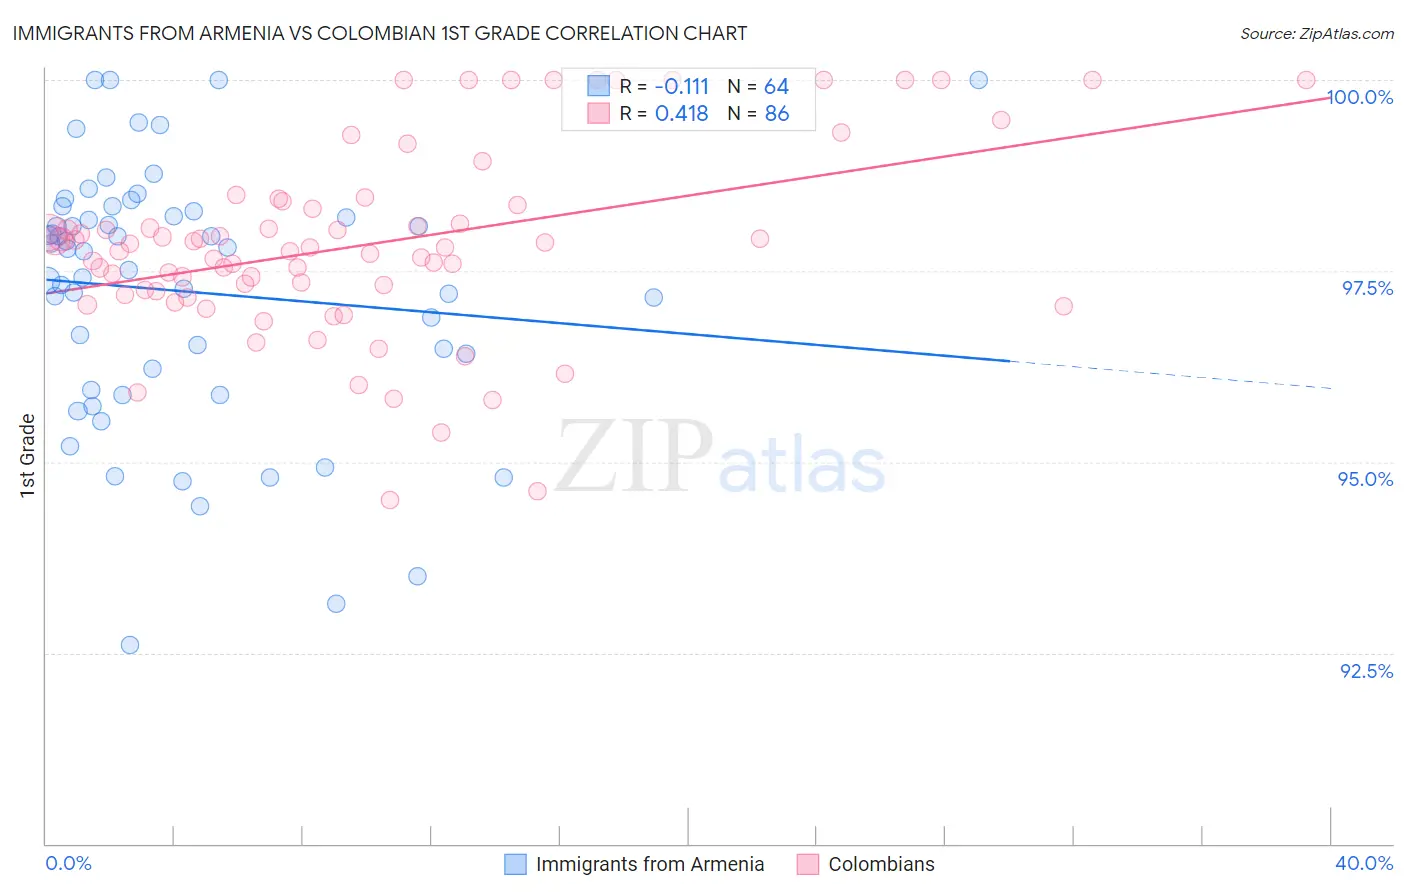
Immigrants from Armenia vs Colombian 1st Grade Correlation Chart
The statistical analysis conducted on geographies consisting of 97,725,276 people shows a poor negative correlation between the proportion of Immigrants from Armenia and percentage of population with at least 1st grade education in the United States with a correlation coefficient (R) of -0.111 and weighted average of 96.6%. Similarly, the statistical analysis conducted on geographies consisting of 419,700,680 people shows a moderate positive correlation between the proportion of Colombians and percentage of population with at least 1st grade education in the United States with a correlation coefficient (R) of 0.418 and weighted average of 97.6%, a difference of 1.1%.
1st Grade Correlation Summary
| Measurement | Immigrants from Armenia | Colombian |
| Minimum | 92.6% | 94.5% |
| Maximum | 100.0% | 100.0% |
| Range | 7.4% | 5.5% |
| Mean | 97.2% | 97.8% |
| Median | 97.8% | 97.8% |
| Interquartile 25% (IQ1) | 96.1% | 97.2% |
| Interquartile 75% (IQ3) | 98.2% | 98.4% |
| Interquartile Range (IQR) | 2.2% | 1.1% |
| Standard Deviation (Sample) | 1.7% | 1.2% |
| Standard Deviation (Population) | 1.7% | 1.2% |
Similar Demographics by 1st Grade
Demographics Similar to Immigrants from Armenia by 1st Grade
In terms of 1st grade, the demographic groups most similar to Immigrants from Armenia are Immigrants from Vietnam (96.6%, a difference of 0.020%), Japanese (96.6%, a difference of 0.030%), Central American (96.5%, a difference of 0.050%), Immigrants from Dominican Republic (96.5%, a difference of 0.060%), and Bangladeshi (96.5%, a difference of 0.060%).
| Demographics | Rating | Rank | 1st Grade |
| Vietnamese | 0.0 /100 | #324 | Tragic 96.8% |
| Dominicans | 0.0 /100 | #325 | Tragic 96.7% |
| Indonesians | 0.0 /100 | #326 | Tragic 96.7% |
| Mexicans | 0.0 /100 | #327 | Tragic 96.7% |
| Immigrants | Latin America | 0.0 /100 | #328 | Tragic 96.7% |
| Japanese | 0.0 /100 | #329 | Tragic 96.6% |
| Immigrants | Vietnam | 0.0 /100 | #330 | Tragic 96.6% |
| Immigrants | Armenia | 0.0 /100 | #331 | Tragic 96.6% |
| Central Americans | 0.0 /100 | #332 | Tragic 96.5% |
| Immigrants | Dominican Republic | 0.0 /100 | #333 | Tragic 96.5% |
| Bangladeshis | 0.0 /100 | #334 | Tragic 96.5% |
| Yakama | 0.0 /100 | #335 | Tragic 96.5% |
| Guatemalans | 0.0 /100 | #336 | Tragic 96.5% |
| Immigrants | Cambodia | 0.0 /100 | #337 | Tragic 96.5% |
| Immigrants | Fiji | 0.0 /100 | #338 | Tragic 96.4% |
Demographics Similar to Colombians by 1st Grade
In terms of 1st grade, the demographic groups most similar to Colombians are Immigrants from Pakistan (97.6%, a difference of 0.0%), Immigrants from Malaysia (97.6%, a difference of 0.0%), Immigrants from Western Asia (97.6%, a difference of 0.0%), Immigrants from Uruguay (97.6%, a difference of 0.010%), and U.S. Virgin Islander (97.6%, a difference of 0.010%).
| Demographics | Rating | Rank | 1st Grade |
| Sierra Leoneans | 3.6 /100 | #227 | Tragic 97.7% |
| Sub-Saharan Africans | 3.6 /100 | #228 | Tragic 97.7% |
| Immigrants | Costa Rica | 3.5 /100 | #229 | Tragic 97.7% |
| Senegalese | 3.5 /100 | #230 | Tragic 97.7% |
| Puerto Ricans | 3.0 /100 | #231 | Tragic 97.7% |
| Immigrants | Uruguay | 2.5 /100 | #232 | Tragic 97.6% |
| Immigrants | Pakistan | 2.2 /100 | #233 | Tragic 97.6% |
| Colombians | 2.2 /100 | #234 | Tragic 97.6% |
| Immigrants | Malaysia | 2.1 /100 | #235 | Tragic 97.6% |
| Immigrants | Western Asia | 2.1 /100 | #236 | Tragic 97.6% |
| U.S. Virgin Islanders | 1.9 /100 | #237 | Tragic 97.6% |
| Nigerians | 1.8 /100 | #238 | Tragic 97.6% |
| Immigrants | Eastern Asia | 1.6 /100 | #239 | Tragic 97.6% |
| Koreans | 1.5 /100 | #240 | Tragic 97.6% |
| Liberians | 1.4 /100 | #241 | Tragic 97.6% |