Yaqui vs Scandinavian Nursery School
COMPARE
Yaqui
Scandinavian
Nursery School
Nursery School Comparison
Yaqui
Scandinavians
97.6%
NURSERY SCHOOL
0.6/ 100
METRIC RATING
256th/ 347
METRIC RANK
98.6%
NURSERY SCHOOL
100.0/ 100
METRIC RATING
33rd/ 347
METRIC RANK
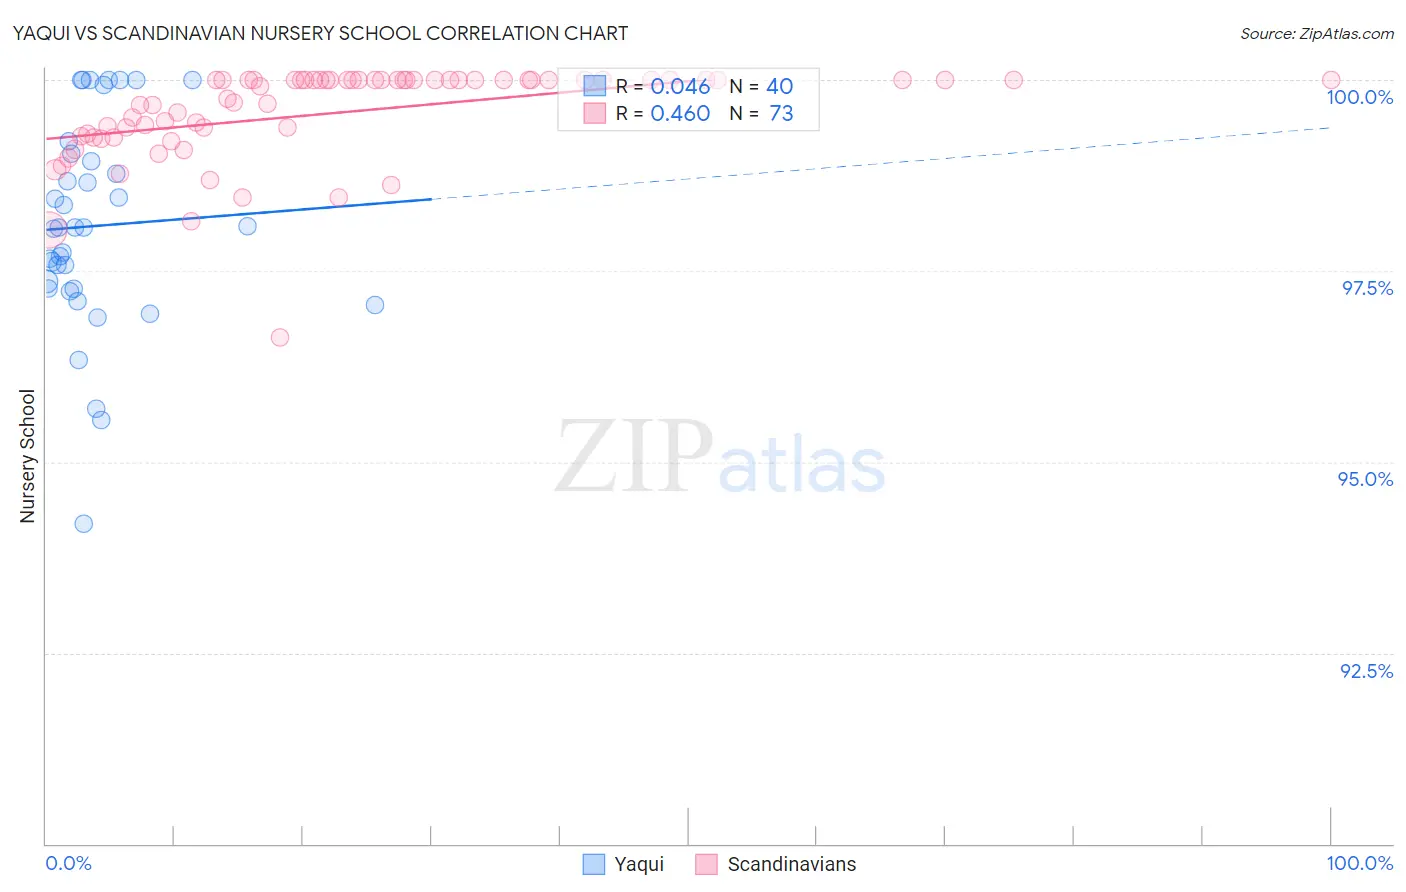
Yaqui vs Scandinavian Nursery School Correlation Chart
The statistical analysis conducted on geographies consisting of 107,732,380 people shows no correlation between the proportion of Yaqui and percentage of population with at least nursery school education in the United States with a correlation coefficient (R) of 0.046 and weighted average of 97.6%. Similarly, the statistical analysis conducted on geographies consisting of 472,660,430 people shows a moderate positive correlation between the proportion of Scandinavians and percentage of population with at least nursery school education in the United States with a correlation coefficient (R) of 0.460 and weighted average of 98.6%, a difference of 1.0%.
Nursery School Correlation Summary
| Measurement | Yaqui | Scandinavian |
| Minimum | 94.2% | 96.6% |
| Maximum | 100.0% | 100.0% |
| Range | 5.8% | 3.4% |
| Mean | 98.1% | 99.6% |
| Median | 98.1% | 100.0% |
| Interquartile 25% (IQ1) | 97.3% | 99.3% |
| Interquartile 75% (IQ3) | 99.0% | 100.0% |
| Interquartile Range (IQR) | 1.7% | 0.74% |
| Standard Deviation (Sample) | 1.4% | 0.62% |
| Standard Deviation (Population) | 1.3% | 0.62% |
Similar Demographics by Nursery School
Demographics Similar to Yaqui by Nursery School
In terms of nursery school, the demographic groups most similar to Yaqui are Immigrants from Colombia (97.6%, a difference of 0.0%), Immigrants from Africa (97.6%, a difference of 0.010%), Immigrants from Iraq (97.6%, a difference of 0.010%), Immigrants from Congo (97.6%, a difference of 0.010%), and Immigrants from Asia (97.6%, a difference of 0.010%).
| Demographics | Rating | Rank | Nursery School |
| Immigrants | Eastern Africa | 0.9 /100 | #249 | Tragic 97.6% |
| Immigrants | Senegal | 0.9 /100 | #250 | Tragic 97.6% |
| Ethiopians | 0.8 /100 | #251 | Tragic 97.6% |
| Immigrants | Africa | 0.8 /100 | #252 | Tragic 97.6% |
| Immigrants | Iraq | 0.7 /100 | #253 | Tragic 97.6% |
| Immigrants | Congo | 0.7 /100 | #254 | Tragic 97.6% |
| Immigrants | Asia | 0.7 /100 | #255 | Tragic 97.6% |
| Yaqui | 0.6 /100 | #256 | Tragic 97.6% |
| Immigrants | Colombia | 0.6 /100 | #257 | Tragic 97.6% |
| Jamaicans | 0.6 /100 | #258 | Tragic 97.6% |
| Armenians | 0.4 /100 | #259 | Tragic 97.6% |
| Immigrants | South America | 0.4 /100 | #260 | Tragic 97.6% |
| Cubans | 0.4 /100 | #261 | Tragic 97.6% |
| Immigrants | Ethiopia | 0.4 /100 | #262 | Tragic 97.6% |
| Fijians | 0.3 /100 | #263 | Tragic 97.6% |
Demographics Similar to Scandinavians by Nursery School
In terms of nursery school, the demographic groups most similar to Scandinavians are French (98.6%, a difference of 0.010%), European (98.6%, a difference of 0.010%), Czech (98.6%, a difference of 0.010%), French Canadian (98.6%, a difference of 0.010%), and Croatian (98.6%, a difference of 0.020%).
| Demographics | Rating | Rank | Nursery School |
| Sioux | 100.0 /100 | #26 | Exceptional 98.6% |
| Arapaho | 100.0 /100 | #27 | Exceptional 98.6% |
| Croatians | 100.0 /100 | #28 | Exceptional 98.6% |
| French | 100.0 /100 | #29 | Exceptional 98.6% |
| Europeans | 100.0 /100 | #30 | Exceptional 98.6% |
| Czechs | 100.0 /100 | #31 | Exceptional 98.6% |
| French Canadians | 100.0 /100 | #32 | Exceptional 98.6% |
| Scandinavians | 100.0 /100 | #33 | Exceptional 98.6% |
| Chinese | 100.0 /100 | #34 | Exceptional 98.6% |
| Swiss | 100.0 /100 | #35 | Exceptional 98.6% |
| British | 100.0 /100 | #36 | Exceptional 98.5% |
| Lumbee | 99.9 /100 | #37 | Exceptional 98.5% |
| Italians | 99.9 /100 | #38 | Exceptional 98.5% |
| Latvians | 99.9 /100 | #39 | Exceptional 98.5% |
| Chippewa | 99.9 /100 | #40 | Exceptional 98.5% |