Yaqui vs Immigrants from Netherlands Nursery School
COMPARE
Yaqui
Immigrants from Netherlands
Nursery School
Nursery School Comparison
Yaqui
Immigrants from Netherlands
97.6%
NURSERY SCHOOL
0.6/ 100
METRIC RATING
256th/ 347
METRIC RANK
98.4%
NURSERY SCHOOL
99.4/ 100
METRIC RATING
74th/ 347
METRIC RANK
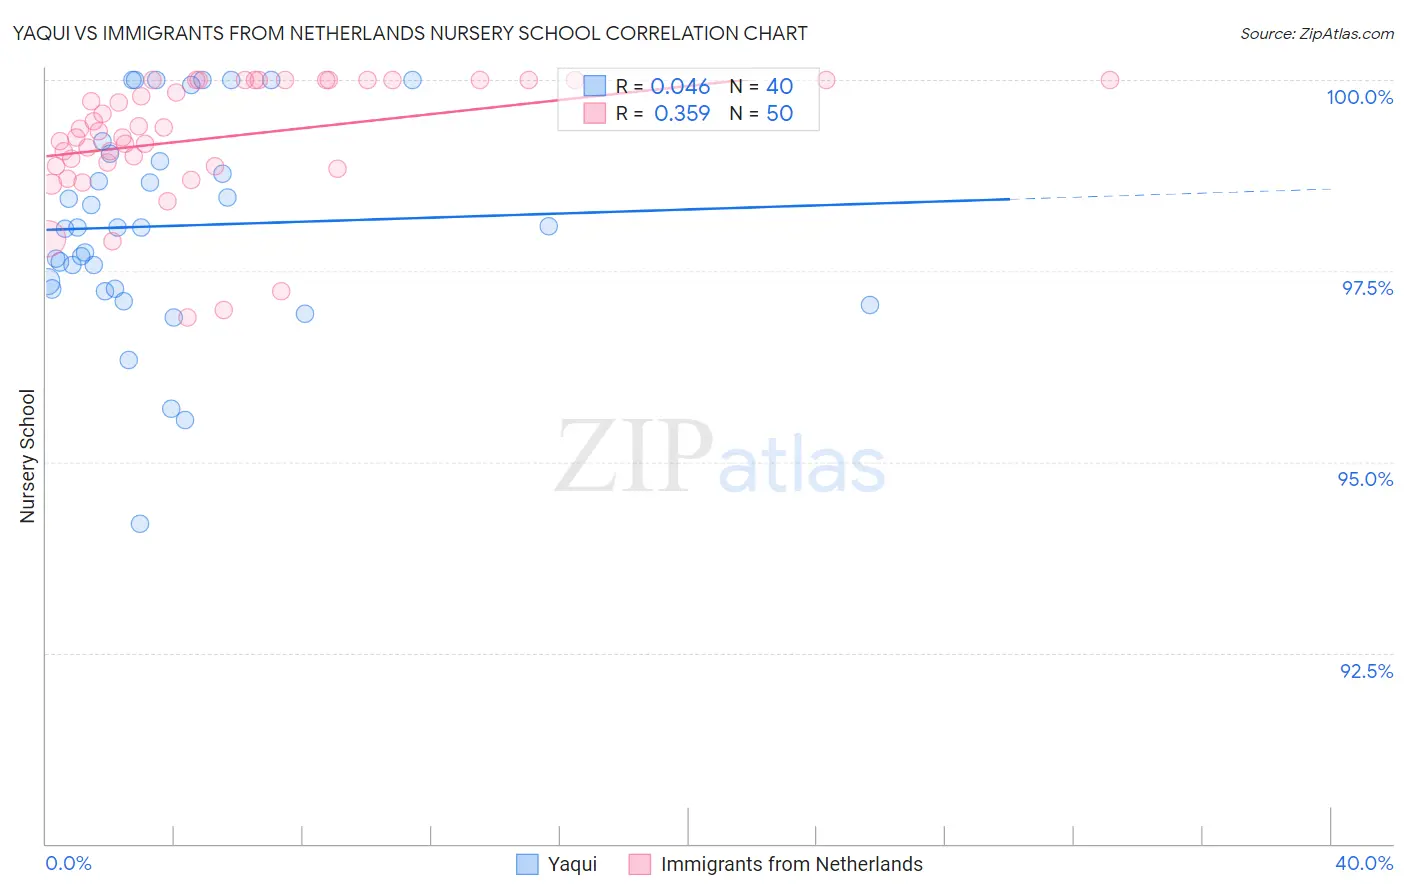
Yaqui vs Immigrants from Netherlands Nursery School Correlation Chart
The statistical analysis conducted on geographies consisting of 107,732,380 people shows no correlation between the proportion of Yaqui and percentage of population with at least nursery school education in the United States with a correlation coefficient (R) of 0.046 and weighted average of 97.6%. Similarly, the statistical analysis conducted on geographies consisting of 237,869,934 people shows a mild positive correlation between the proportion of Immigrants from Netherlands and percentage of population with at least nursery school education in the United States with a correlation coefficient (R) of 0.359 and weighted average of 98.4%, a difference of 0.76%.
Nursery School Correlation Summary
| Measurement | Yaqui | Immigrants from Netherlands |
| Minimum | 94.2% | 96.9% |
| Maximum | 100.0% | 100.0% |
| Range | 5.8% | 3.1% |
| Mean | 98.1% | 99.2% |
| Median | 98.1% | 99.3% |
| Interquartile 25% (IQ1) | 97.3% | 98.9% |
| Interquartile 75% (IQ3) | 99.0% | 100.0% |
| Interquartile Range (IQR) | 1.7% | 1.1% |
| Standard Deviation (Sample) | 1.4% | 0.80% |
| Standard Deviation (Population) | 1.3% | 0.79% |
Similar Demographics by Nursery School
Demographics Similar to Yaqui by Nursery School
In terms of nursery school, the demographic groups most similar to Yaqui are Immigrants from Colombia (97.6%, a difference of 0.0%), Immigrants from Africa (97.6%, a difference of 0.010%), Immigrants from Iraq (97.6%, a difference of 0.010%), Immigrants from Congo (97.6%, a difference of 0.010%), and Immigrants from Asia (97.6%, a difference of 0.010%).
| Demographics | Rating | Rank | Nursery School |
| Immigrants | Eastern Africa | 0.9 /100 | #249 | Tragic 97.6% |
| Immigrants | Senegal | 0.9 /100 | #250 | Tragic 97.6% |
| Ethiopians | 0.8 /100 | #251 | Tragic 97.6% |
| Immigrants | Africa | 0.8 /100 | #252 | Tragic 97.6% |
| Immigrants | Iraq | 0.7 /100 | #253 | Tragic 97.6% |
| Immigrants | Congo | 0.7 /100 | #254 | Tragic 97.6% |
| Immigrants | Asia | 0.7 /100 | #255 | Tragic 97.6% |
| Yaqui | 0.6 /100 | #256 | Tragic 97.6% |
| Immigrants | Colombia | 0.6 /100 | #257 | Tragic 97.6% |
| Jamaicans | 0.6 /100 | #258 | Tragic 97.6% |
| Armenians | 0.4 /100 | #259 | Tragic 97.6% |
| Immigrants | South America | 0.4 /100 | #260 | Tragic 97.6% |
| Cubans | 0.4 /100 | #261 | Tragic 97.6% |
| Immigrants | Ethiopia | 0.4 /100 | #262 | Tragic 97.6% |
| Fijians | 0.3 /100 | #263 | Tragic 97.6% |
Demographics Similar to Immigrants from Netherlands by Nursery School
In terms of nursery school, the demographic groups most similar to Immigrants from Netherlands are Cajun (98.4%, a difference of 0.0%), Cherokee (98.3%, a difference of 0.010%), Immigrants from England (98.3%, a difference of 0.010%), Immigrants from Lithuania (98.3%, a difference of 0.010%), and Delaware (98.3%, a difference of 0.010%).
| Demographics | Rating | Rank | Nursery School |
| Immigrants | Northern Europe | 99.6 /100 | #67 | Exceptional 98.4% |
| Russians | 99.6 /100 | #68 | Exceptional 98.4% |
| Immigrants | Austria | 99.6 /100 | #69 | Exceptional 98.4% |
| Cheyenne | 99.6 /100 | #70 | Exceptional 98.4% |
| Serbians | 99.6 /100 | #71 | Exceptional 98.4% |
| Chickasaw | 99.6 /100 | #72 | Exceptional 98.4% |
| Cajuns | 99.4 /100 | #73 | Exceptional 98.4% |
| Immigrants | Netherlands | 99.4 /100 | #74 | Exceptional 98.4% |
| Cherokee | 99.3 /100 | #75 | Exceptional 98.3% |
| Immigrants | England | 99.3 /100 | #76 | Exceptional 98.3% |
| Immigrants | Lithuania | 99.3 /100 | #77 | Exceptional 98.3% |
| Delaware | 99.3 /100 | #78 | Exceptional 98.3% |
| Immigrants | Belgium | 99.3 /100 | #79 | Exceptional 98.3% |
| Shoshone | 99.3 /100 | #80 | Exceptional 98.3% |
| Icelanders | 99.2 /100 | #81 | Exceptional 98.3% |