Immigrants from Norway vs Scandinavian Nursery School
COMPARE
Immigrants from Norway
Scandinavian
Nursery School
Nursery School Comparison
Immigrants from Norway
Scandinavians
98.2%
NURSERY SCHOOL
96.6/ 100
METRIC RATING
112th/ 347
METRIC RANK
98.6%
NURSERY SCHOOL
100.0/ 100
METRIC RATING
33rd/ 347
METRIC RANK
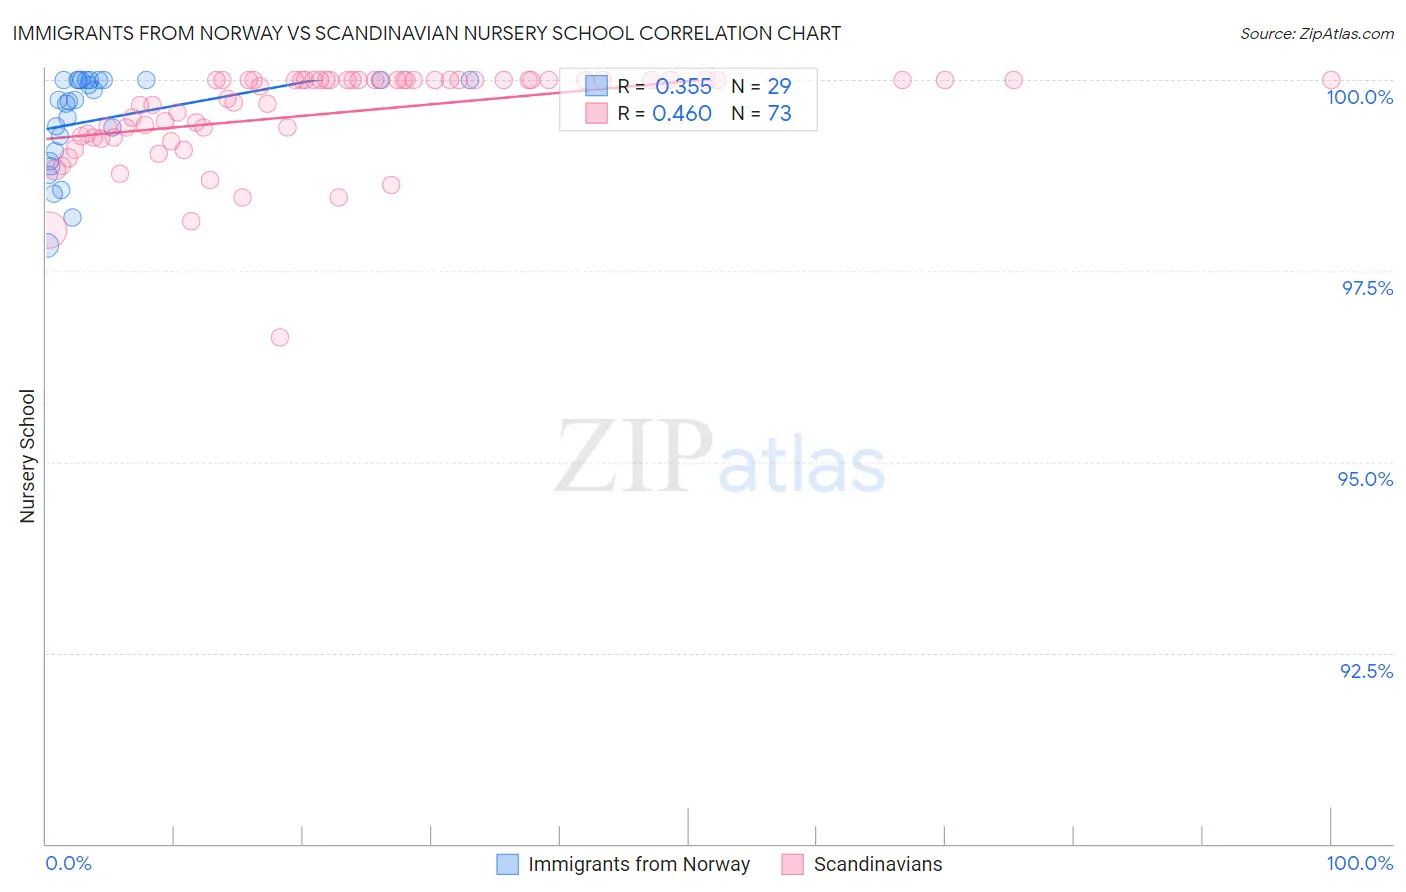
Immigrants from Norway vs Scandinavian Nursery School Correlation Chart
The statistical analysis conducted on geographies consisting of 116,716,420 people shows a mild positive correlation between the proportion of Immigrants from Norway and percentage of population with at least nursery school education in the United States with a correlation coefficient (R) of 0.355 and weighted average of 98.2%. Similarly, the statistical analysis conducted on geographies consisting of 472,660,430 people shows a moderate positive correlation between the proportion of Scandinavians and percentage of population with at least nursery school education in the United States with a correlation coefficient (R) of 0.460 and weighted average of 98.6%, a difference of 0.36%.
Nursery School Correlation Summary
| Measurement | Immigrants from Norway | Scandinavian |
| Minimum | 97.8% | 96.6% |
| Maximum | 100.0% | 100.0% |
| Range | 2.2% | 3.4% |
| Mean | 99.5% | 99.6% |
| Median | 99.7% | 100.0% |
| Interquartile 25% (IQ1) | 99.0% | 99.3% |
| Interquartile 75% (IQ3) | 100.0% | 100.0% |
| Interquartile Range (IQR) | 1.00% | 0.74% |
| Standard Deviation (Sample) | 0.63% | 0.62% |
| Standard Deviation (Population) | 0.62% | 0.62% |
Similar Demographics by Nursery School
Demographics Similar to Immigrants from Norway by Nursery School
In terms of nursery school, the demographic groups most similar to Immigrants from Norway are Immigrants from Latvia (98.2%, a difference of 0.0%), Pima (98.2%, a difference of 0.010%), German Russian (98.2%, a difference of 0.010%), Immigrants from Singapore (98.2%, a difference of 0.010%), and Immigrants from Czechoslovakia (98.2%, a difference of 0.010%).
| Demographics | Rating | Rank | Nursery School |
| Turks | 97.4 /100 | #105 | Exceptional 98.2% |
| Immigrants | Switzerland | 97.3 /100 | #106 | Exceptional 98.2% |
| Basques | 97.3 /100 | #107 | Exceptional 98.2% |
| Pima | 97.1 /100 | #108 | Exceptional 98.2% |
| German Russians | 97.1 /100 | #109 | Exceptional 98.2% |
| Immigrants | Singapore | 96.9 /100 | #110 | Exceptional 98.2% |
| Immigrants | Czechoslovakia | 96.8 /100 | #111 | Exceptional 98.2% |
| Immigrants | Norway | 96.6 /100 | #112 | Exceptional 98.2% |
| Immigrants | Latvia | 96.4 /100 | #113 | Exceptional 98.2% |
| Ute | 96.4 /100 | #114 | Exceptional 98.2% |
| Iranians | 96.3 /100 | #115 | Exceptional 98.2% |
| Spanish | 95.8 /100 | #116 | Exceptional 98.2% |
| Immigrants | France | 95.6 /100 | #117 | Exceptional 98.2% |
| Yugoslavians | 95.4 /100 | #118 | Exceptional 98.2% |
| Thais | 95.0 /100 | #119 | Exceptional 98.2% |
Demographics Similar to Scandinavians by Nursery School
In terms of nursery school, the demographic groups most similar to Scandinavians are French (98.6%, a difference of 0.010%), European (98.6%, a difference of 0.010%), Czech (98.6%, a difference of 0.010%), French Canadian (98.6%, a difference of 0.010%), and Croatian (98.6%, a difference of 0.020%).
| Demographics | Rating | Rank | Nursery School |
| Sioux | 100.0 /100 | #26 | Exceptional 98.6% |
| Arapaho | 100.0 /100 | #27 | Exceptional 98.6% |
| Croatians | 100.0 /100 | #28 | Exceptional 98.6% |
| French | 100.0 /100 | #29 | Exceptional 98.6% |
| Europeans | 100.0 /100 | #30 | Exceptional 98.6% |
| Czechs | 100.0 /100 | #31 | Exceptional 98.6% |
| French Canadians | 100.0 /100 | #32 | Exceptional 98.6% |
| Scandinavians | 100.0 /100 | #33 | Exceptional 98.6% |
| Chinese | 100.0 /100 | #34 | Exceptional 98.6% |
| Swiss | 100.0 /100 | #35 | Exceptional 98.6% |
| British | 100.0 /100 | #36 | Exceptional 98.5% |
| Lumbee | 99.9 /100 | #37 | Exceptional 98.5% |
| Italians | 99.9 /100 | #38 | Exceptional 98.5% |
| Latvians | 99.9 /100 | #39 | Exceptional 98.5% |
| Chippewa | 99.9 /100 | #40 | Exceptional 98.5% |