Yaqui vs Scandinavian In Labor Force | Age 45-54
COMPARE
Yaqui
Scandinavian
In Labor Force | Age 45-54
In Labor Force | Age 45-54 Comparison
Yaqui
Scandinavians
78.9%
IN LABOR FORCE | AGE 45-54
0.0/ 100
METRIC RATING
320th/ 347
METRIC RANK
83.0%
IN LABOR FORCE | AGE 45-54
78.5/ 100
METRIC RATING
139th/ 347
METRIC RANK
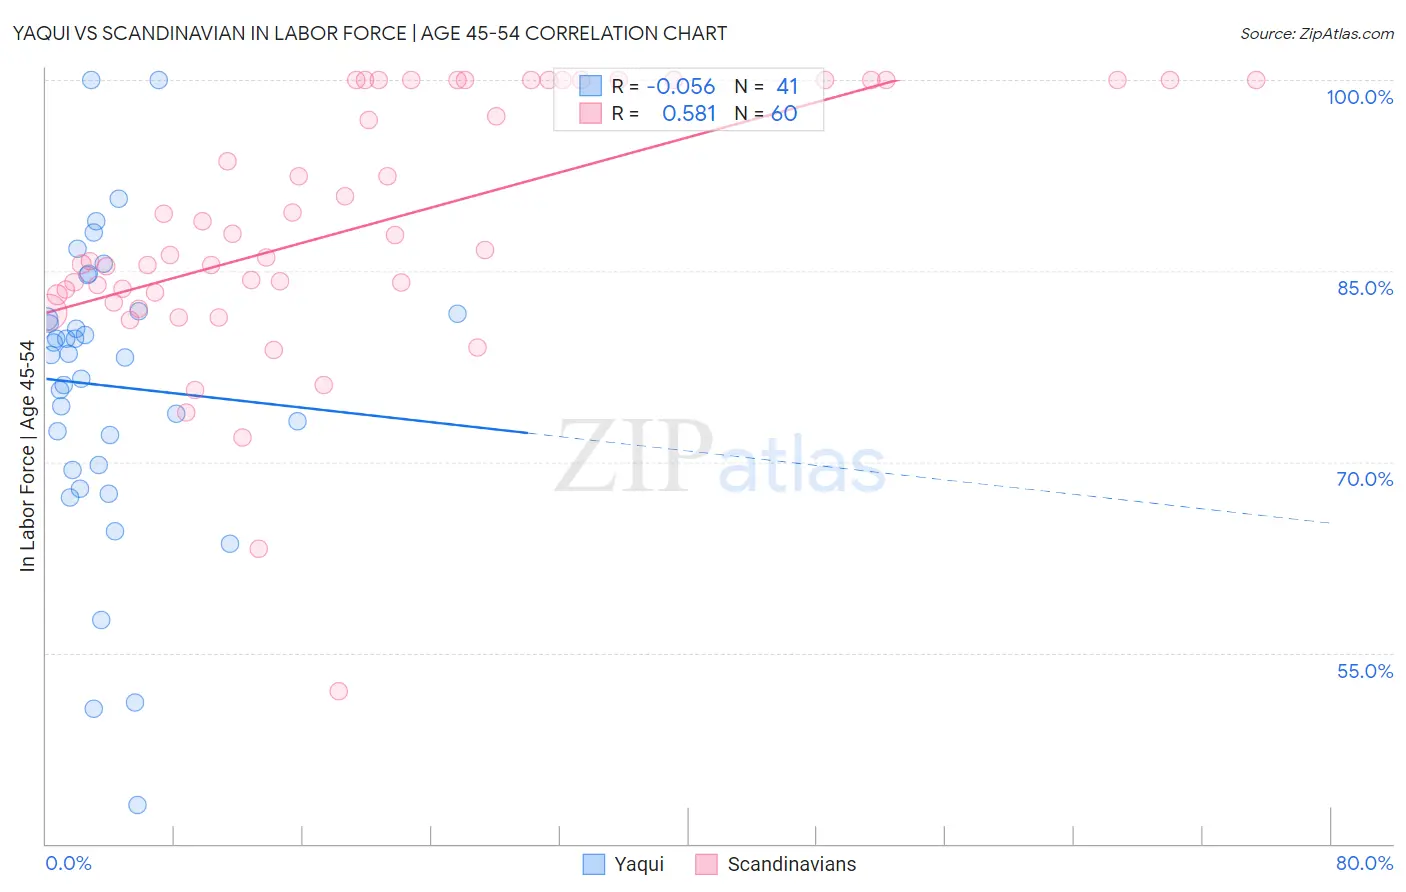
Yaqui vs Scandinavian In Labor Force | Age 45-54 Correlation Chart
The statistical analysis conducted on geographies consisting of 107,713,051 people shows a slight negative correlation between the proportion of Yaqui and labor force participation rate among population between the ages 45 and 54 in the United States with a correlation coefficient (R) of -0.056 and weighted average of 78.9%. Similarly, the statistical analysis conducted on geographies consisting of 472,233,572 people shows a substantial positive correlation between the proportion of Scandinavians and labor force participation rate among population between the ages 45 and 54 in the United States with a correlation coefficient (R) of 0.581 and weighted average of 83.0%, a difference of 5.2%.
In Labor Force | Age 45-54 Correlation Summary
| Measurement | Yaqui | Scandinavian |
| Minimum | 43.0% | 52.0% |
| Maximum | 100.0% | 100.0% |
| Range | 57.0% | 48.0% |
| Mean | 76.0% | 88.5% |
| Median | 78.4% | 86.5% |
| Interquartile 25% (IQ1) | 69.6% | 83.3% |
| Interquartile 75% (IQ3) | 81.7% | 100.0% |
| Interquartile Range (IQR) | 12.1% | 16.7% |
| Standard Deviation (Sample) | 11.8% | 10.2% |
| Standard Deviation (Population) | 11.7% | 10.1% |
Similar Demographics by In Labor Force | Age 45-54
Demographics Similar to Yaqui by In Labor Force | Age 45-54
In terms of in labor force | age 45-54, the demographic groups most similar to Yaqui are Cherokee (79.0%, a difference of 0.10%), Chickasaw (79.0%, a difference of 0.21%), Yup'ik (78.6%, a difference of 0.30%), Comanche (79.2%, a difference of 0.38%), and Shoshone (79.3%, a difference of 0.52%).
| Demographics | Rating | Rank | In Labor Force | Age 45-54 |
| Colville | 0.0 /100 | #313 | Tragic 79.5% |
| Ottawa | 0.0 /100 | #314 | Tragic 79.5% |
| Blacks/African Americans | 0.0 /100 | #315 | Tragic 79.3% |
| Shoshone | 0.0 /100 | #316 | Tragic 79.3% |
| Comanche | 0.0 /100 | #317 | Tragic 79.2% |
| Chickasaw | 0.0 /100 | #318 | Tragic 79.0% |
| Cherokee | 0.0 /100 | #319 | Tragic 79.0% |
| Yaqui | 0.0 /100 | #320 | Tragic 78.9% |
| Yup'ik | 0.0 /100 | #321 | Tragic 78.6% |
| Crow | 0.0 /100 | #322 | Tragic 78.3% |
| Kiowa | 0.0 /100 | #323 | Tragic 78.3% |
| Dutch West Indians | 0.0 /100 | #324 | Tragic 78.2% |
| Choctaw | 0.0 /100 | #325 | Tragic 78.2% |
| Seminole | 0.0 /100 | #326 | Tragic 78.1% |
| Cajuns | 0.0 /100 | #327 | Tragic 78.1% |
Demographics Similar to Scandinavians by In Labor Force | Age 45-54
In terms of in labor force | age 45-54, the demographic groups most similar to Scandinavians are Yugoslavian (83.0%, a difference of 0.0%), Ghanaian (83.0%, a difference of 0.010%), Immigrants from Haiti (83.0%, a difference of 0.010%), Immigrants from Scotland (83.0%, a difference of 0.010%), and Okinawan (83.0%, a difference of 0.020%).
| Demographics | Rating | Rank | In Labor Force | Age 45-54 |
| Immigrants | Ukraine | 82.9 /100 | #132 | Excellent 83.0% |
| Liberians | 82.7 /100 | #133 | Excellent 83.0% |
| Sudanese | 82.0 /100 | #134 | Excellent 83.0% |
| Austrians | 81.3 /100 | #135 | Excellent 83.0% |
| Immigrants | Kazakhstan | 81.0 /100 | #136 | Excellent 83.0% |
| Immigrants | Spain | 80.4 /100 | #137 | Excellent 83.0% |
| Ghanaians | 79.5 /100 | #138 | Good 83.0% |
| Scandinavians | 78.5 /100 | #139 | Good 83.0% |
| Yugoslavians | 78.3 /100 | #140 | Good 83.0% |
| Immigrants | Haiti | 77.9 /100 | #141 | Good 83.0% |
| Immigrants | Scotland | 77.8 /100 | #142 | Good 83.0% |
| Okinawans | 77.0 /100 | #143 | Good 83.0% |
| Soviet Union | 76.8 /100 | #144 | Good 83.0% |
| Romanians | 75.4 /100 | #145 | Good 83.0% |
| Immigrants | France | 75.3 /100 | #146 | Good 83.0% |