Cambodian vs Scandinavian Nursery School
COMPARE
Cambodian
Scandinavian
Nursery School
Nursery School Comparison
Cambodians
Scandinavians
98.2%
NURSERY SCHOOL
91.4/ 100
METRIC RATING
129th/ 347
METRIC RANK
98.6%
NURSERY SCHOOL
100.0/ 100
METRIC RATING
33rd/ 347
METRIC RANK
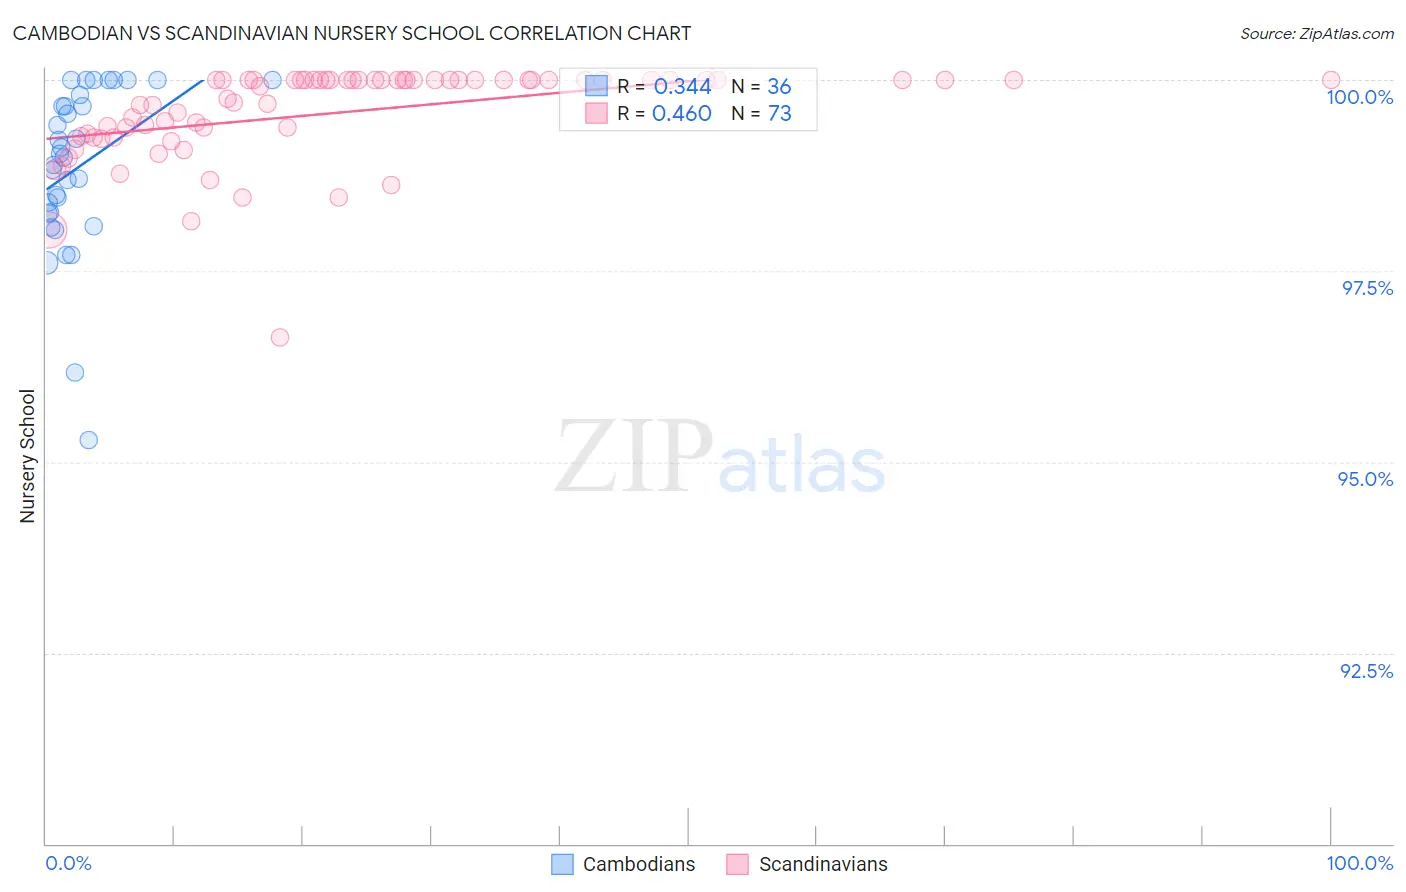
Cambodian vs Scandinavian Nursery School Correlation Chart
The statistical analysis conducted on geographies consisting of 102,511,743 people shows a mild positive correlation between the proportion of Cambodians and percentage of population with at least nursery school education in the United States with a correlation coefficient (R) of 0.344 and weighted average of 98.2%. Similarly, the statistical analysis conducted on geographies consisting of 472,660,430 people shows a moderate positive correlation between the proportion of Scandinavians and percentage of population with at least nursery school education in the United States with a correlation coefficient (R) of 0.460 and weighted average of 98.6%, a difference of 0.44%.
Nursery School Correlation Summary
| Measurement | Cambodian | Scandinavian |
| Minimum | 95.3% | 96.6% |
| Maximum | 100.0% | 100.0% |
| Range | 4.7% | 3.4% |
| Mean | 98.9% | 99.6% |
| Median | 99.0% | 100.0% |
| Interquartile 25% (IQ1) | 98.3% | 99.3% |
| Interquartile 75% (IQ3) | 99.7% | 100.0% |
| Interquartile Range (IQR) | 1.5% | 0.74% |
| Standard Deviation (Sample) | 1.1% | 0.62% |
| Standard Deviation (Population) | 1.1% | 0.62% |
Similar Demographics by Nursery School
Demographics Similar to Cambodians by Nursery School
In terms of nursery school, the demographic groups most similar to Cambodians are Immigrants from Croatia (98.2%, a difference of 0.0%), Spaniard (98.2%, a difference of 0.0%), Seminole (98.2%, a difference of 0.0%), Immigrants from Serbia (98.2%, a difference of 0.010%), and Immigrants from Europe (98.1%, a difference of 0.010%).
| Demographics | Rating | Rank | Nursery School |
| Immigrants | Japan | 94.0 /100 | #122 | Exceptional 98.2% |
| Syrians | 93.9 /100 | #123 | Exceptional 98.2% |
| Lebanese | 93.8 /100 | #124 | Exceptional 98.2% |
| Iroquois | 93.7 /100 | #125 | Exceptional 98.2% |
| Menominee | 93.6 /100 | #126 | Exceptional 98.2% |
| Immigrants | Saudi Arabia | 93.4 /100 | #127 | Exceptional 98.2% |
| Immigrants | Serbia | 92.4 /100 | #128 | Exceptional 98.2% |
| Cambodians | 91.4 /100 | #129 | Exceptional 98.2% |
| Immigrants | Croatia | 91.4 /100 | #130 | Exceptional 98.2% |
| Spaniards | 91.1 /100 | #131 | Exceptional 98.2% |
| Seminole | 90.9 /100 | #132 | Exceptional 98.2% |
| Immigrants | Europe | 90.7 /100 | #133 | Exceptional 98.1% |
| Immigrants | Bulgaria | 89.4 /100 | #134 | Excellent 98.1% |
| Immigrants | Hungary | 89.3 /100 | #135 | Excellent 98.1% |
| Immigrants | Kuwait | 88.9 /100 | #136 | Excellent 98.1% |
Demographics Similar to Scandinavians by Nursery School
In terms of nursery school, the demographic groups most similar to Scandinavians are French (98.6%, a difference of 0.010%), European (98.6%, a difference of 0.010%), Czech (98.6%, a difference of 0.010%), French Canadian (98.6%, a difference of 0.010%), and Croatian (98.6%, a difference of 0.020%).
| Demographics | Rating | Rank | Nursery School |
| Sioux | 100.0 /100 | #26 | Exceptional 98.6% |
| Arapaho | 100.0 /100 | #27 | Exceptional 98.6% |
| Croatians | 100.0 /100 | #28 | Exceptional 98.6% |
| French | 100.0 /100 | #29 | Exceptional 98.6% |
| Europeans | 100.0 /100 | #30 | Exceptional 98.6% |
| Czechs | 100.0 /100 | #31 | Exceptional 98.6% |
| French Canadians | 100.0 /100 | #32 | Exceptional 98.6% |
| Scandinavians | 100.0 /100 | #33 | Exceptional 98.6% |
| Chinese | 100.0 /100 | #34 | Exceptional 98.6% |
| Swiss | 100.0 /100 | #35 | Exceptional 98.6% |
| British | 100.0 /100 | #36 | Exceptional 98.5% |
| Lumbee | 99.9 /100 | #37 | Exceptional 98.5% |
| Italians | 99.9 /100 | #38 | Exceptional 98.5% |
| Latvians | 99.9 /100 | #39 | Exceptional 98.5% |
| Chippewa | 99.9 /100 | #40 | Exceptional 98.5% |