Yaqui vs Immigrants from Bolivia Nursery School
COMPARE
Yaqui
Immigrants from Bolivia
Nursery School
Nursery School Comparison
Yaqui
Immigrants from Bolivia
97.6%
NURSERY SCHOOL
0.6/ 100
METRIC RATING
256th/ 347
METRIC RANK
97.5%
NURSERY SCHOOL
0.1/ 100
METRIC RATING
272nd/ 347
METRIC RANK
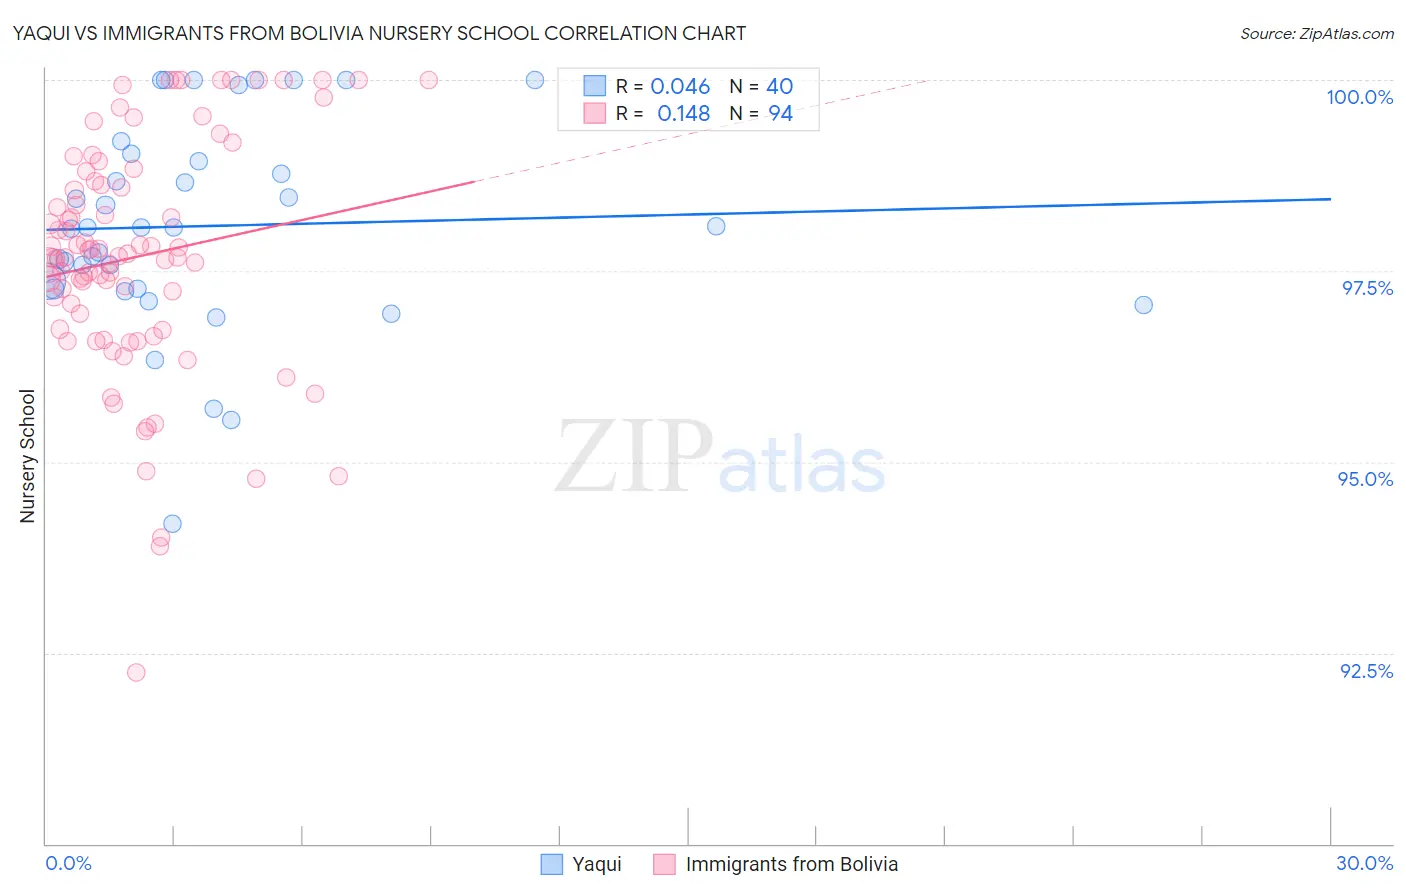
Yaqui vs Immigrants from Bolivia Nursery School Correlation Chart
The statistical analysis conducted on geographies consisting of 107,732,380 people shows no correlation between the proportion of Yaqui and percentage of population with at least nursery school education in the United States with a correlation coefficient (R) of 0.046 and weighted average of 97.6%. Similarly, the statistical analysis conducted on geographies consisting of 158,728,833 people shows a poor positive correlation between the proportion of Immigrants from Bolivia and percentage of population with at least nursery school education in the United States with a correlation coefficient (R) of 0.148 and weighted average of 97.5%, a difference of 0.11%.
Nursery School Correlation Summary
| Measurement | Yaqui | Immigrants from Bolivia |
| Minimum | 94.2% | 92.2% |
| Maximum | 100.0% | 100.0% |
| Range | 5.8% | 7.8% |
| Mean | 98.1% | 97.7% |
| Median | 98.1% | 97.7% |
| Interquartile 25% (IQ1) | 97.3% | 96.7% |
| Interquartile 75% (IQ3) | 99.0% | 98.7% |
| Interquartile Range (IQR) | 1.7% | 1.9% |
| Standard Deviation (Sample) | 1.4% | 1.5% |
| Standard Deviation (Population) | 1.3% | 1.5% |
Demographics Similar to Yaqui and Immigrants from Bolivia by Nursery School
In terms of nursery school, the demographic groups most similar to Yaqui are Immigrants from Colombia (97.6%, a difference of 0.0%), Immigrants from Congo (97.6%, a difference of 0.010%), Immigrants from Asia (97.6%, a difference of 0.010%), Jamaican (97.6%, a difference of 0.010%), and Armenian (97.6%, a difference of 0.030%). Similarly, the demographic groups most similar to Immigrants from Bolivia are Immigrants from Peru (97.5%, a difference of 0.020%), Immigrants from China (97.5%, a difference of 0.020%), Immigrants from Cameroon (97.5%, a difference of 0.020%), Immigrants from Jamaica (97.5%, a difference of 0.030%), and Immigrants from Nigeria (97.5%, a difference of 0.050%).
| Demographics | Rating | Rank | Nursery School |
| Immigrants | Congo | 0.7 /100 | #254 | Tragic 97.6% |
| Immigrants | Asia | 0.7 /100 | #255 | Tragic 97.6% |
| Yaqui | 0.6 /100 | #256 | Tragic 97.6% |
| Immigrants | Colombia | 0.6 /100 | #257 | Tragic 97.6% |
| Jamaicans | 0.6 /100 | #258 | Tragic 97.6% |
| Armenians | 0.4 /100 | #259 | Tragic 97.6% |
| Immigrants | South America | 0.4 /100 | #260 | Tragic 97.6% |
| Cubans | 0.4 /100 | #261 | Tragic 97.6% |
| Immigrants | Ethiopia | 0.4 /100 | #262 | Tragic 97.6% |
| Fijians | 0.3 /100 | #263 | Tragic 97.6% |
| Taiwanese | 0.3 /100 | #264 | Tragic 97.6% |
| Assyrians/Chaldeans/Syriacs | 0.3 /100 | #265 | Tragic 97.6% |
| Immigrants | Sierra Leone | 0.3 /100 | #266 | Tragic 97.6% |
| Immigrants | Nigeria | 0.3 /100 | #267 | Tragic 97.5% |
| West Indians | 0.3 /100 | #268 | Tragic 97.5% |
| Immigrants | Liberia | 0.3 /100 | #269 | Tragic 97.5% |
| Immigrants | Jamaica | 0.2 /100 | #270 | Tragic 97.5% |
| Immigrants | Peru | 0.2 /100 | #271 | Tragic 97.5% |
| Immigrants | Bolivia | 0.1 /100 | #272 | Tragic 97.5% |
| Immigrants | China | 0.1 /100 | #273 | Tragic 97.5% |
| Immigrants | Cameroon | 0.1 /100 | #274 | Tragic 97.5% |