Greek vs Paraguayan Associate's Degree
COMPARE
Greek
Paraguayan
Associate's Degree
Associate's Degree Comparison
Greeks
Paraguayans
50.3%
ASSOCIATE'S DEGREE
98.9/ 100
METRIC RATING
82nd/ 347
METRIC RANK
51.8%
ASSOCIATE'S DEGREE
99.8/ 100
METRIC RATING
57th/ 347
METRIC RANK
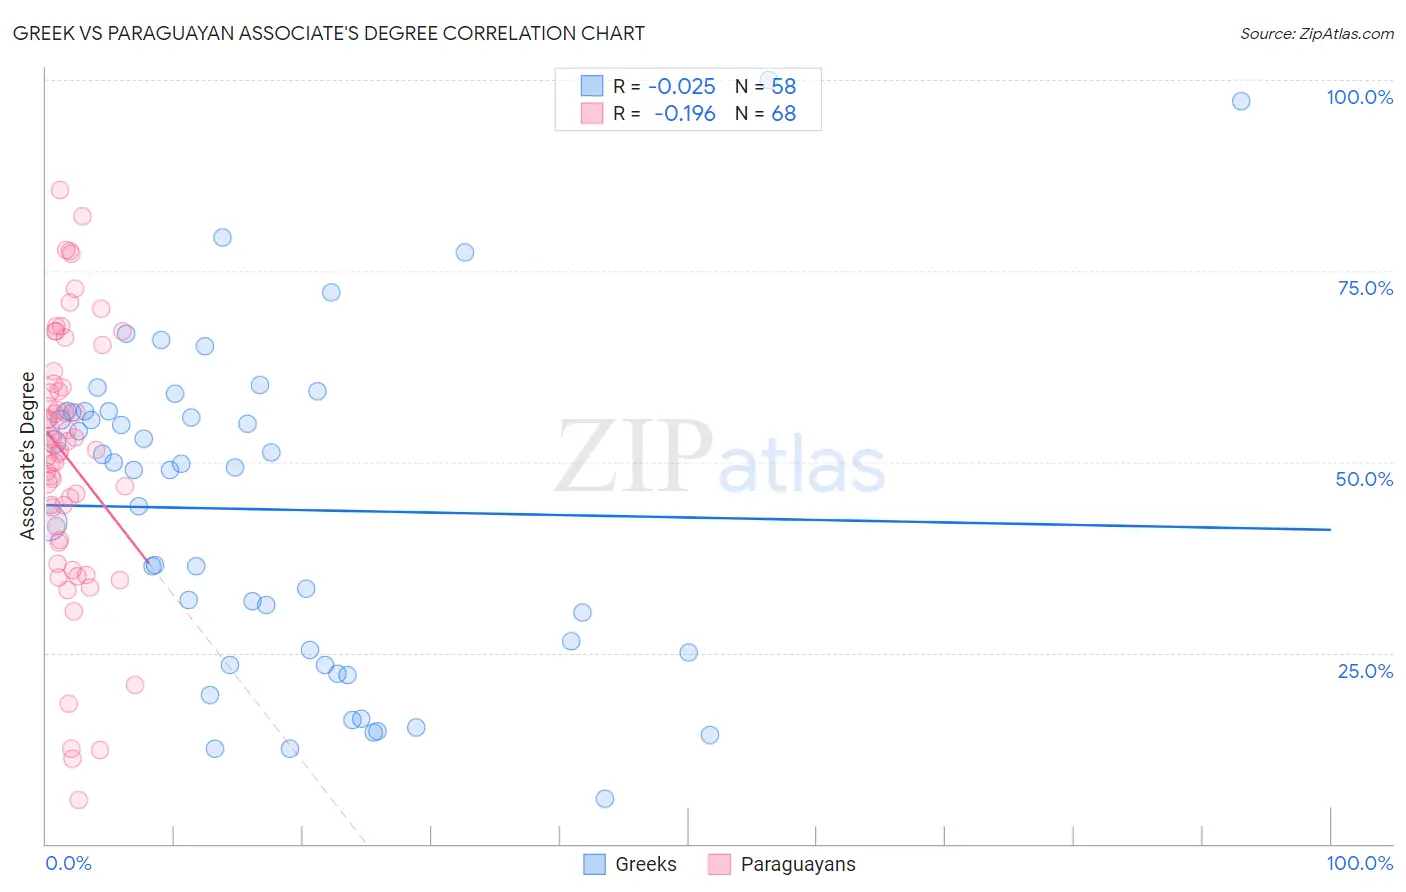
Greek vs Paraguayan Associate's Degree Correlation Chart
The statistical analysis conducted on geographies consisting of 482,724,257 people shows no correlation between the proportion of Greeks and percentage of population with at least associate's degree education in the United States with a correlation coefficient (R) of -0.025 and weighted average of 50.3%. Similarly, the statistical analysis conducted on geographies consisting of 95,113,072 people shows a poor negative correlation between the proportion of Paraguayans and percentage of population with at least associate's degree education in the United States with a correlation coefficient (R) of -0.196 and weighted average of 51.8%, a difference of 3.1%.
Associate's Degree Correlation Summary
| Measurement | Greek | Paraguayan |
| Minimum | 5.9% | 5.7% |
| Maximum | 100.0% | 85.7% |
| Range | 94.1% | 79.9% |
| Mean | 43.8% | 50.4% |
| Median | 49.2% | 52.0% |
| Interquartile 25% (IQ1) | 25.0% | 40.7% |
| Interquartile 75% (IQ3) | 56.6% | 60.0% |
| Interquartile Range (IQR) | 31.6% | 19.3% |
| Standard Deviation (Sample) | 21.4% | 17.1% |
| Standard Deviation (Population) | 21.2% | 17.0% |
Similar Demographics by Associate's Degree
Demographics Similar to Greeks by Associate's Degree
In terms of associate's degree, the demographic groups most similar to Greeks are Immigrants from Uzbekistan (50.3%, a difference of 0.040%), Immigrants from Hungary (50.2%, a difference of 0.060%), Immigrants from Egypt (50.2%, a difference of 0.11%), Immigrants from Croatia (50.2%, a difference of 0.12%), and Maltese (50.4%, a difference of 0.23%).
| Demographics | Rating | Rank | Associate's Degree |
| Immigrants | Scotland | 99.3 /100 | #75 | Exceptional 50.6% |
| Immigrants | Zimbabwe | 99.2 /100 | #76 | Exceptional 50.5% |
| Immigrants | Lebanon | 99.1 /100 | #77 | Exceptional 50.5% |
| Immigrants | Eastern Europe | 99.1 /100 | #78 | Exceptional 50.5% |
| Ethiopians | 99.1 /100 | #79 | Exceptional 50.4% |
| Armenians | 99.1 /100 | #80 | Exceptional 50.4% |
| Maltese | 99.1 /100 | #81 | Exceptional 50.4% |
| Greeks | 98.9 /100 | #82 | Exceptional 50.3% |
| Immigrants | Uzbekistan | 98.9 /100 | #83 | Exceptional 50.3% |
| Immigrants | Hungary | 98.9 /100 | #84 | Exceptional 50.2% |
| Immigrants | Egypt | 98.9 /100 | #85 | Exceptional 50.2% |
| Immigrants | Croatia | 98.9 /100 | #86 | Exceptional 50.2% |
| Immigrants | Moldova | 98.8 /100 | #87 | Exceptional 50.2% |
| Immigrants | Canada | 98.7 /100 | #88 | Exceptional 50.1% |
| Immigrants | Western Europe | 98.7 /100 | #89 | Exceptional 50.1% |
Demographics Similar to Paraguayans by Associate's Degree
In terms of associate's degree, the demographic groups most similar to Paraguayans are New Zealander (51.8%, a difference of 0.030%), Immigrants from Czechoslovakia (51.9%, a difference of 0.12%), Australian (51.9%, a difference of 0.14%), Immigrants from Serbia (51.7%, a difference of 0.16%), and Immigrants from Spain (51.9%, a difference of 0.17%).
| Demographics | Rating | Rank | Associate's Degree |
| Asians | 99.9 /100 | #50 | Exceptional 52.1% |
| Immigrants | Greece | 99.9 /100 | #51 | Exceptional 52.1% |
| Bolivians | 99.8 /100 | #52 | Exceptional 52.0% |
| Immigrants | Asia | 99.8 /100 | #53 | Exceptional 52.0% |
| Immigrants | Spain | 99.8 /100 | #54 | Exceptional 51.9% |
| Australians | 99.8 /100 | #55 | Exceptional 51.9% |
| Immigrants | Czechoslovakia | 99.8 /100 | #56 | Exceptional 51.9% |
| Paraguayans | 99.8 /100 | #57 | Exceptional 51.8% |
| New Zealanders | 99.8 /100 | #58 | Exceptional 51.8% |
| Immigrants | Serbia | 99.8 /100 | #59 | Exceptional 51.7% |
| Immigrants | Bolivia | 99.7 /100 | #60 | Exceptional 51.5% |
| Immigrants | Kazakhstan | 99.7 /100 | #61 | Exceptional 51.4% |
| Bhutanese | 99.7 /100 | #62 | Exceptional 51.4% |
| South Africans | 99.7 /100 | #63 | Exceptional 51.4% |
| Immigrants | Netherlands | 99.7 /100 | #64 | Exceptional 51.4% |