Immigrants from Micronesia vs Immigrants from India Master's Degree
COMPARE
Immigrants from Micronesia
Immigrants from India
Master's Degree
Master's Degree Comparison
Immigrants from Micronesia
Immigrants from India
10.8%
MASTER'S DEGREE
0.0/ 100
METRIC RATING
320th/ 347
METRIC RANK
22.3%
MASTER'S DEGREE
100.0/ 100
METRIC RATING
6th/ 347
METRIC RANK
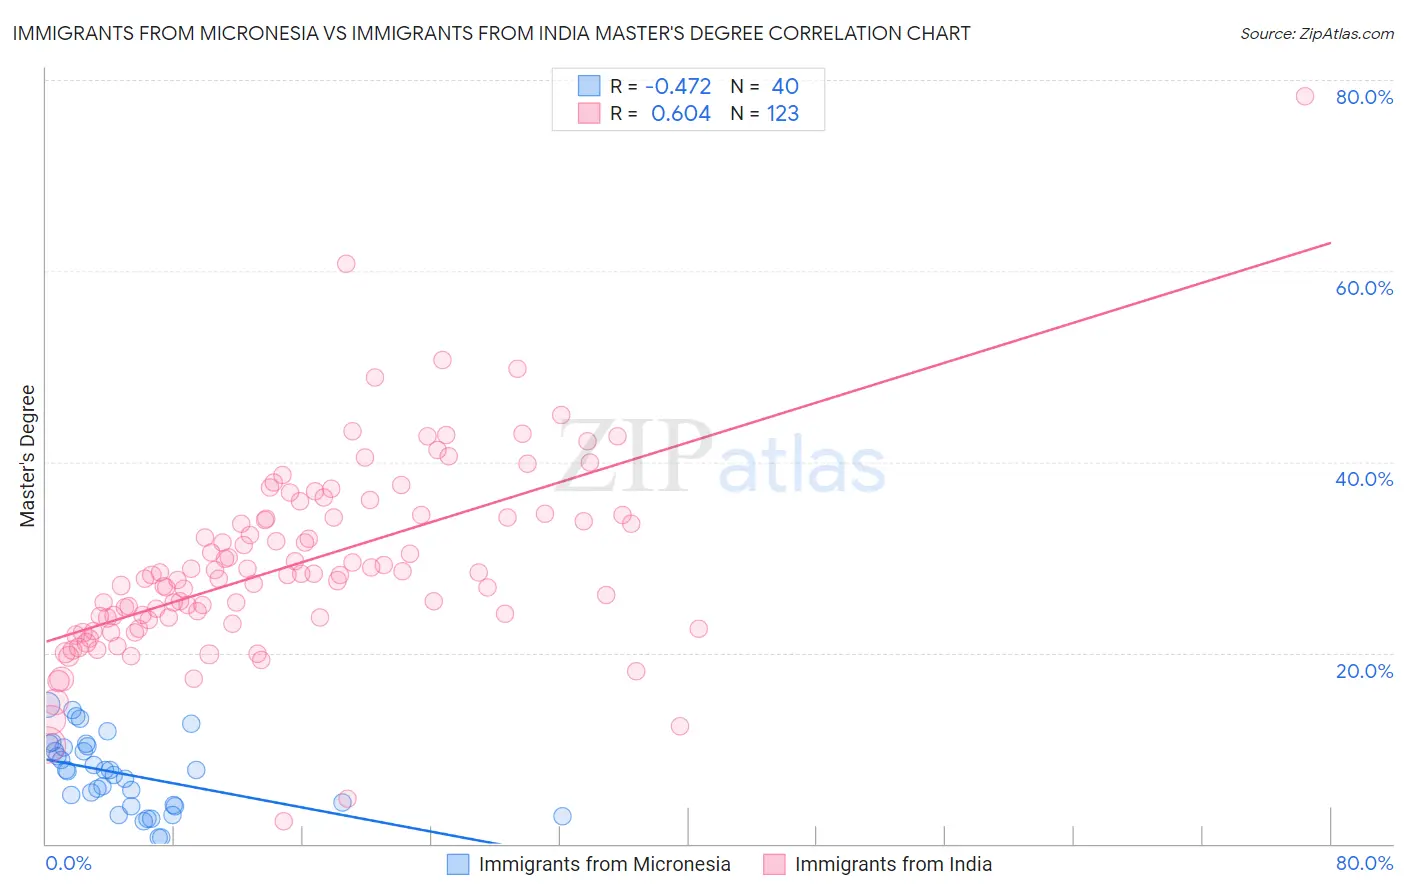
Immigrants from Micronesia vs Immigrants from India Master's Degree Correlation Chart
The statistical analysis conducted on geographies consisting of 61,602,639 people shows a moderate negative correlation between the proportion of Immigrants from Micronesia and percentage of population with at least master's degree education in the United States with a correlation coefficient (R) of -0.472 and weighted average of 10.8%. Similarly, the statistical analysis conducted on geographies consisting of 433,961,661 people shows a significant positive correlation between the proportion of Immigrants from India and percentage of population with at least master's degree education in the United States with a correlation coefficient (R) of 0.604 and weighted average of 22.3%, a difference of 107.3%.
Master's Degree Correlation Summary
| Measurement | Immigrants from Micronesia | Immigrants from India |
| Minimum | 0.67% | 2.4% |
| Maximum | 14.6% | 78.4% |
| Range | 13.9% | 76.0% |
| Mean | 7.3% | 29.2% |
| Median | 7.7% | 28.2% |
| Interquartile 25% (IQ1) | 4.0% | 23.4% |
| Interquartile 75% (IQ3) | 10.2% | 34.2% |
| Interquartile Range (IQR) | 6.1% | 10.8% |
| Standard Deviation (Sample) | 3.8% | 10.1% |
| Standard Deviation (Population) | 3.7% | 10.0% |
Similar Demographics by Master's Degree
Demographics Similar to Immigrants from Micronesia by Master's Degree
In terms of master's degree, the demographic groups most similar to Immigrants from Micronesia are Pennsylvania German (10.7%, a difference of 0.21%), Kiowa (10.8%, a difference of 0.62%), Sioux (10.7%, a difference of 0.85%), Immigrants from Cuba (10.9%, a difference of 0.86%), and Hopi (10.9%, a difference of 0.99%).
| Demographics | Rating | Rank | Master's Degree |
| Yaqui | 0.0 /100 | #313 | Tragic 11.0% |
| Cajuns | 0.0 /100 | #314 | Tragic 11.0% |
| Apache | 0.0 /100 | #315 | Tragic 11.0% |
| Hispanics or Latinos | 0.0 /100 | #316 | Tragic 10.9% |
| Hopi | 0.0 /100 | #317 | Tragic 10.9% |
| Immigrants | Cuba | 0.0 /100 | #318 | Tragic 10.9% |
| Kiowa | 0.0 /100 | #319 | Tragic 10.8% |
| Immigrants | Micronesia | 0.0 /100 | #320 | Tragic 10.8% |
| Pennsylvania Germans | 0.0 /100 | #321 | Tragic 10.7% |
| Sioux | 0.0 /100 | #322 | Tragic 10.7% |
| Crow | 0.0 /100 | #323 | Tragic 10.6% |
| Dutch West Indians | 0.0 /100 | #324 | Tragic 10.6% |
| Inupiat | 0.0 /100 | #325 | Tragic 10.5% |
| Creek | 0.0 /100 | #326 | Tragic 10.5% |
| Paiute | 0.0 /100 | #327 | Tragic 10.5% |
Demographics Similar to Immigrants from India by Master's Degree
In terms of master's degree, the demographic groups most similar to Immigrants from India are Iranian (22.3%, a difference of 0.21%), Immigrants from Taiwan (22.5%, a difference of 0.68%), Immigrants from Israel (22.6%, a difference of 1.5%), Okinawan (22.6%, a difference of 1.5%), and Cypriot (21.8%, a difference of 2.4%).
| Demographics | Rating | Rank | Master's Degree |
| Immigrants | Singapore | 100.0 /100 | #1 | Exceptional 23.4% |
| Filipinos | 100.0 /100 | #2 | Exceptional 23.4% |
| Immigrants | Israel | 100.0 /100 | #3 | Exceptional 22.6% |
| Okinawans | 100.0 /100 | #4 | Exceptional 22.6% |
| Immigrants | Taiwan | 100.0 /100 | #5 | Exceptional 22.5% |
| Immigrants | India | 100.0 /100 | #6 | Exceptional 22.3% |
| Iranians | 100.0 /100 | #7 | Exceptional 22.3% |
| Cypriots | 100.0 /100 | #8 | Exceptional 21.8% |
| Thais | 100.0 /100 | #9 | Exceptional 21.7% |
| Immigrants | Iran | 100.0 /100 | #10 | Exceptional 21.6% |
| Immigrants | China | 100.0 /100 | #11 | Exceptional 21.2% |
| Eastern Europeans | 100.0 /100 | #12 | Exceptional 21.1% |
| Immigrants | Australia | 100.0 /100 | #13 | Exceptional 20.9% |
| Immigrants | Switzerland | 100.0 /100 | #14 | Exceptional 20.9% |
| Immigrants | Eastern Asia | 100.0 /100 | #15 | Exceptional 20.8% |