Mexican American Indian vs Immigrants from India Master's Degree
COMPARE
Mexican American Indian
Immigrants from India
Master's Degree
Master's Degree Comparison
Mexican American Indians
Immigrants from India
11.2%
MASTER'S DEGREE
0.0/ 100
METRIC RATING
306th/ 347
METRIC RANK
22.3%
MASTER'S DEGREE
100.0/ 100
METRIC RATING
6th/ 347
METRIC RANK
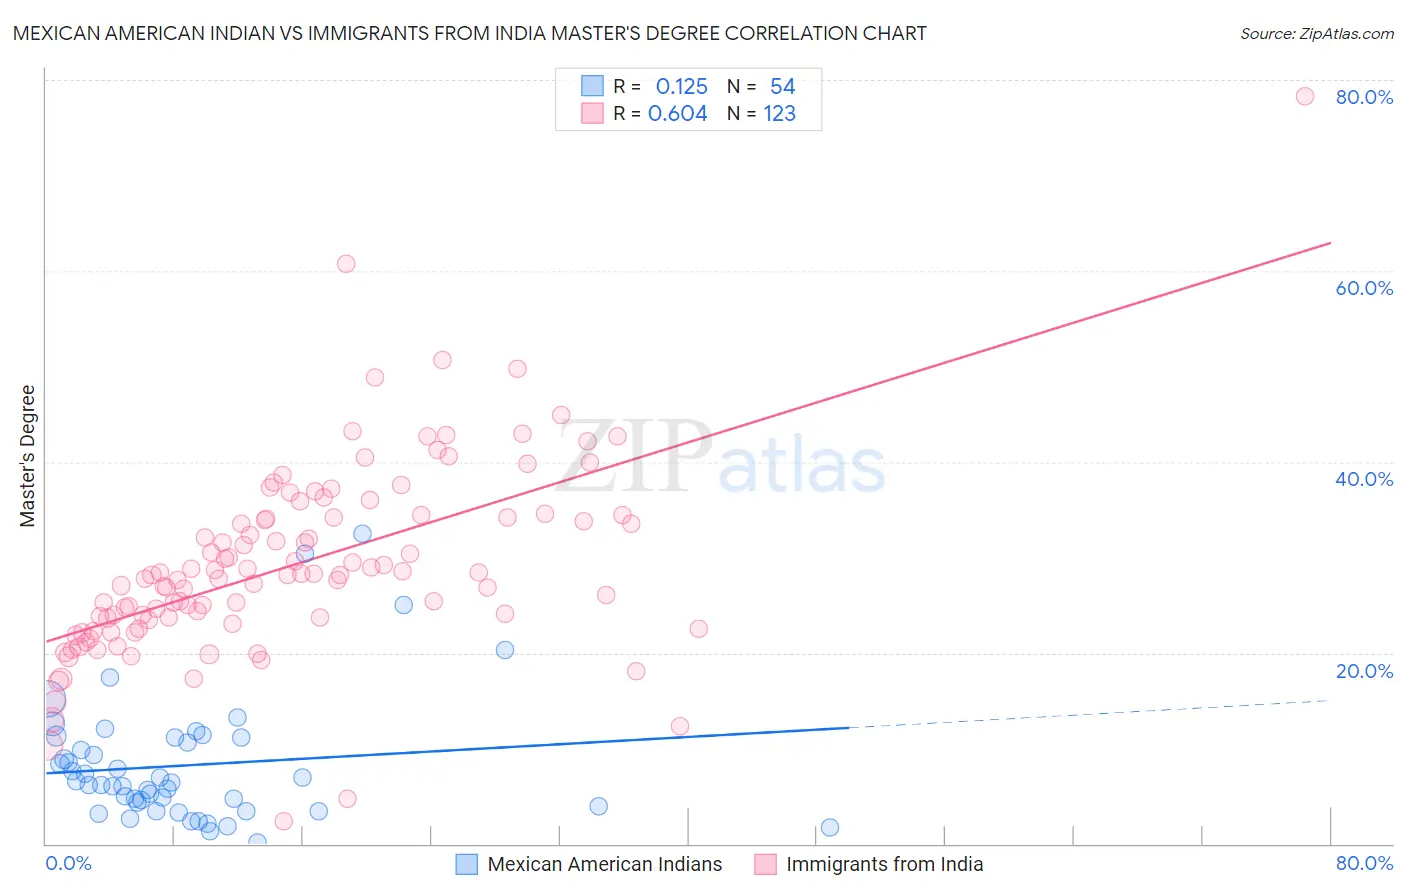
Mexican American Indian vs Immigrants from India Master's Degree Correlation Chart
The statistical analysis conducted on geographies consisting of 317,480,404 people shows a poor positive correlation between the proportion of Mexican American Indians and percentage of population with at least master's degree education in the United States with a correlation coefficient (R) of 0.125 and weighted average of 11.2%. Similarly, the statistical analysis conducted on geographies consisting of 433,961,661 people shows a significant positive correlation between the proportion of Immigrants from India and percentage of population with at least master's degree education in the United States with a correlation coefficient (R) of 0.604 and weighted average of 22.3%, a difference of 98.4%.
Master's Degree Correlation Summary
| Measurement | Mexican American Indian | Immigrants from India |
| Minimum | 0.093% | 2.4% |
| Maximum | 32.5% | 78.4% |
| Range | 32.4% | 76.0% |
| Mean | 8.2% | 29.2% |
| Median | 6.3% | 28.2% |
| Interquartile 25% (IQ1) | 4.0% | 23.4% |
| Interquartile 75% (IQ3) | 11.1% | 34.2% |
| Interquartile Range (IQR) | 7.1% | 10.8% |
| Standard Deviation (Sample) | 6.7% | 10.1% |
| Standard Deviation (Population) | 6.6% | 10.0% |
Similar Demographics by Master's Degree
Demographics Similar to Mexican American Indians by Master's Degree
In terms of master's degree, the demographic groups most similar to Mexican American Indians are Cheyenne (11.2%, a difference of 0.15%), Immigrants from Latin America (11.3%, a difference of 0.19%), Puerto Rican (11.2%, a difference of 0.70%), Immigrants from Cabo Verde (11.3%, a difference of 0.84%), and Puget Sound Salish (11.1%, a difference of 0.99%).
| Demographics | Rating | Rank | Master's Degree |
| Chickasaw | 0.1 /100 | #299 | Tragic 11.4% |
| Chippewa | 0.1 /100 | #300 | Tragic 11.4% |
| Tsimshian | 0.1 /100 | #301 | Tragic 11.4% |
| Cherokee | 0.1 /100 | #302 | Tragic 11.4% |
| Immigrants | Laos | 0.1 /100 | #303 | Tragic 11.4% |
| Immigrants | Cabo Verde | 0.1 /100 | #304 | Tragic 11.3% |
| Immigrants | Latin America | 0.0 /100 | #305 | Tragic 11.3% |
| Mexican American Indians | 0.0 /100 | #306 | Tragic 11.2% |
| Cheyenne | 0.0 /100 | #307 | Tragic 11.2% |
| Puerto Ricans | 0.0 /100 | #308 | Tragic 11.2% |
| Puget Sound Salish | 0.0 /100 | #309 | Tragic 11.1% |
| Shoshone | 0.0 /100 | #310 | Tragic 11.1% |
| Seminole | 0.0 /100 | #311 | Tragic 11.0% |
| Choctaw | 0.0 /100 | #312 | Tragic 11.0% |
| Yaqui | 0.0 /100 | #313 | Tragic 11.0% |
Demographics Similar to Immigrants from India by Master's Degree
In terms of master's degree, the demographic groups most similar to Immigrants from India are Iranian (22.3%, a difference of 0.21%), Immigrants from Taiwan (22.5%, a difference of 0.68%), Immigrants from Israel (22.6%, a difference of 1.5%), Okinawan (22.6%, a difference of 1.5%), and Cypriot (21.8%, a difference of 2.4%).
| Demographics | Rating | Rank | Master's Degree |
| Immigrants | Singapore | 100.0 /100 | #1 | Exceptional 23.4% |
| Filipinos | 100.0 /100 | #2 | Exceptional 23.4% |
| Immigrants | Israel | 100.0 /100 | #3 | Exceptional 22.6% |
| Okinawans | 100.0 /100 | #4 | Exceptional 22.6% |
| Immigrants | Taiwan | 100.0 /100 | #5 | Exceptional 22.5% |
| Immigrants | India | 100.0 /100 | #6 | Exceptional 22.3% |
| Iranians | 100.0 /100 | #7 | Exceptional 22.3% |
| Cypriots | 100.0 /100 | #8 | Exceptional 21.8% |
| Thais | 100.0 /100 | #9 | Exceptional 21.7% |
| Immigrants | Iran | 100.0 /100 | #10 | Exceptional 21.6% |
| Immigrants | China | 100.0 /100 | #11 | Exceptional 21.2% |
| Eastern Europeans | 100.0 /100 | #12 | Exceptional 21.1% |
| Immigrants | Australia | 100.0 /100 | #13 | Exceptional 20.9% |
| Immigrants | Switzerland | 100.0 /100 | #14 | Exceptional 20.9% |
| Immigrants | Eastern Asia | 100.0 /100 | #15 | Exceptional 20.8% |