Iraqi vs Immigrants from Belgium Bachelor's Degree
COMPARE
Iraqi
Immigrants from Belgium
Bachelor's Degree
Bachelor's Degree Comparison
Iraqis
Immigrants from Belgium
39.0%
BACHELOR'S DEGREE
78.1/ 100
METRIC RATING
148th/ 347
METRIC RANK
47.0%
BACHELOR'S DEGREE
100.0/ 100
METRIC RATING
22nd/ 347
METRIC RANK
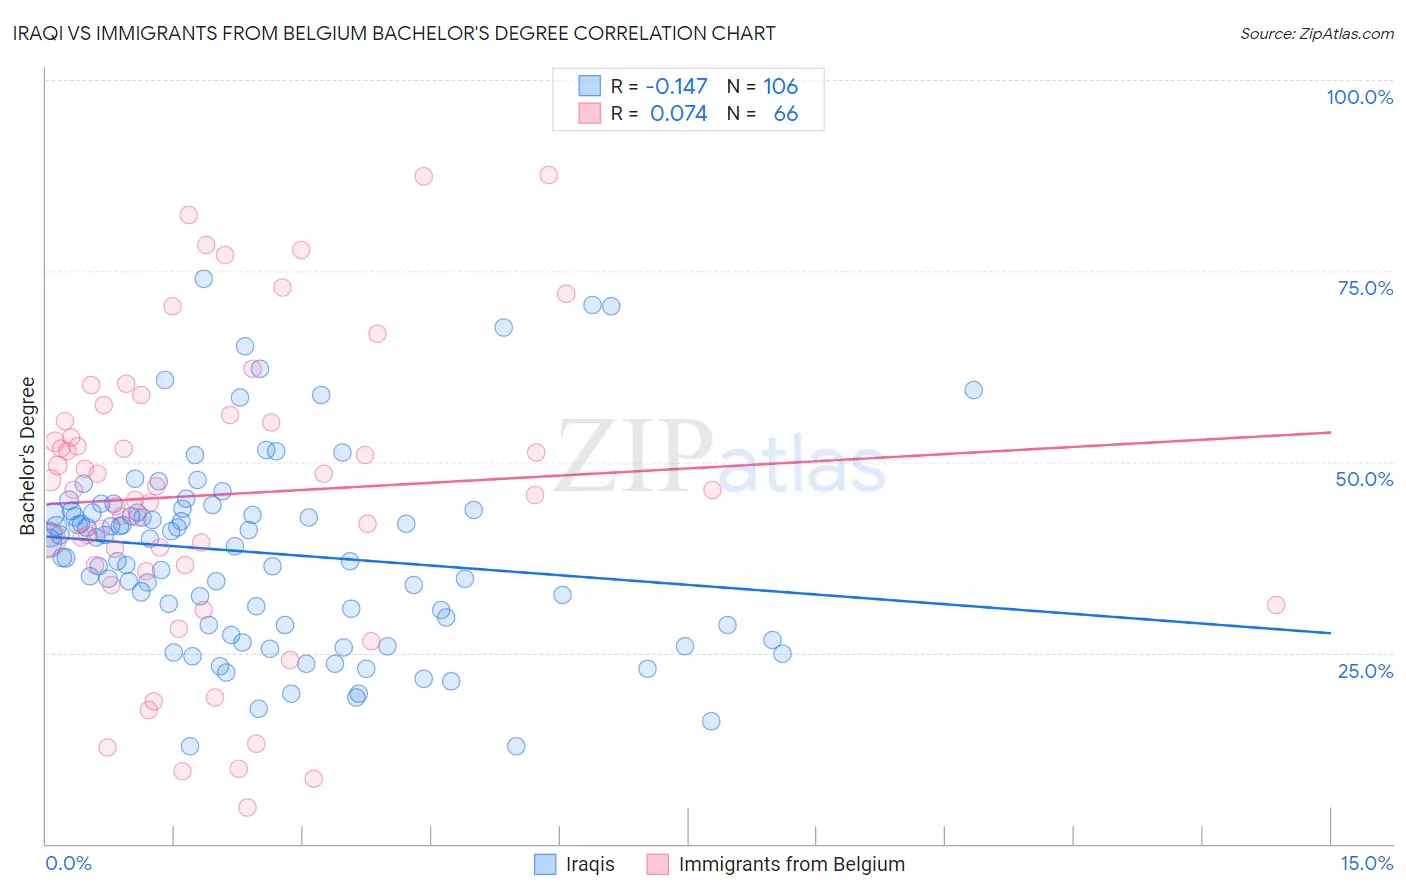
Iraqi vs Immigrants from Belgium Bachelor's Degree Correlation Chart
The statistical analysis conducted on geographies consisting of 170,654,288 people shows a poor negative correlation between the proportion of Iraqis and percentage of population with at least bachelor's degree education in the United States with a correlation coefficient (R) of -0.147 and weighted average of 39.0%. Similarly, the statistical analysis conducted on geographies consisting of 146,728,237 people shows a slight positive correlation between the proportion of Immigrants from Belgium and percentage of population with at least bachelor's degree education in the United States with a correlation coefficient (R) of 0.074 and weighted average of 47.0%, a difference of 20.6%.
Bachelor's Degree Correlation Summary
| Measurement | Iraqi | Immigrants from Belgium |
| Minimum | 12.8% | 4.8% |
| Maximum | 74.1% | 87.6% |
| Range | 61.3% | 82.8% |
| Mean | 38.1% | 45.7% |
| Median | 39.7% | 46.3% |
| Interquartile 25% (IQ1) | 28.6% | 36.5% |
| Interquartile 75% (IQ3) | 43.6% | 55.4% |
| Interquartile Range (IQR) | 15.0% | 18.9% |
| Standard Deviation (Sample) | 12.6% | 19.4% |
| Standard Deviation (Population) | 12.5% | 19.2% |
Similar Demographics by Bachelor's Degree
Demographics Similar to Iraqis by Bachelor's Degree
In terms of bachelor's degree, the demographic groups most similar to Iraqis are Immigrants from Poland (39.0%, a difference of 0.080%), South American (38.9%, a difference of 0.11%), Immigrants from Sierra Leone (39.0%, a difference of 0.14%), Swedish (39.1%, a difference of 0.17%), and Slovene (39.1%, a difference of 0.21%).
| Demographics | Rating | Rank | Bachelor's Degree |
| South American Indians | 83.6 /100 | #141 | Excellent 39.3% |
| Immigrants | North Macedonia | 81.6 /100 | #142 | Excellent 39.2% |
| Poles | 79.8 /100 | #143 | Good 39.1% |
| Immigrants | Afghanistan | 79.7 /100 | #144 | Good 39.1% |
| Slovenes | 79.5 /100 | #145 | Good 39.1% |
| Swedes | 79.2 /100 | #146 | Good 39.1% |
| Immigrants | Sierra Leone | 79.0 /100 | #147 | Good 39.0% |
| Iraqis | 78.1 /100 | #148 | Good 39.0% |
| Immigrants | Poland | 77.5 /100 | #149 | Good 39.0% |
| South Americans | 77.3 /100 | #150 | Good 38.9% |
| Immigrants | Africa | 76.5 /100 | #151 | Good 38.9% |
| Sudanese | 76.4 /100 | #152 | Good 38.9% |
| Slavs | 75.9 /100 | #153 | Good 38.9% |
| Canadians | 75.0 /100 | #154 | Good 38.8% |
| Immigrants | Kenya | 73.8 /100 | #155 | Good 38.8% |
Demographics Similar to Immigrants from Belgium by Bachelor's Degree
In terms of bachelor's degree, the demographic groups most similar to Immigrants from Belgium are Immigrants from Sweden (47.0%, a difference of 0.090%), Immigrants from Korea (47.0%, a difference of 0.13%), Immigrants from Ireland (47.1%, a difference of 0.20%), Immigrants from Switzerland (47.1%, a difference of 0.21%), and Burmese (46.9%, a difference of 0.35%).
| Demographics | Rating | Rank | Bachelor's Degree |
| Immigrants | Eastern Asia | 100.0 /100 | #15 | Exceptional 48.1% |
| Soviet Union | 100.0 /100 | #16 | Exceptional 47.9% |
| Eastern Europeans | 100.0 /100 | #17 | Exceptional 47.5% |
| Indians (Asian) | 100.0 /100 | #18 | Exceptional 47.4% |
| Cambodians | 100.0 /100 | #19 | Exceptional 47.2% |
| Immigrants | Switzerland | 100.0 /100 | #20 | Exceptional 47.1% |
| Immigrants | Ireland | 100.0 /100 | #21 | Exceptional 47.1% |
| Immigrants | Belgium | 100.0 /100 | #22 | Exceptional 47.0% |
| Immigrants | Sweden | 100.0 /100 | #23 | Exceptional 47.0% |
| Immigrants | Korea | 100.0 /100 | #24 | Exceptional 47.0% |
| Burmese | 100.0 /100 | #25 | Exceptional 46.9% |
| Immigrants | Japan | 100.0 /100 | #26 | Exceptional 46.8% |
| Immigrants | France | 100.0 /100 | #27 | Exceptional 46.4% |
| Turks | 100.0 /100 | #28 | Exceptional 46.2% |
| Israelis | 100.0 /100 | #29 | Exceptional 46.1% |