Colombian vs Immigrants from Belgium Bachelor's Degree
COMPARE
Colombian
Immigrants from Belgium
Bachelor's Degree
Bachelor's Degree Comparison
Colombians
Immigrants from Belgium
38.4%
BACHELOR'S DEGREE
65.0/ 100
METRIC RATING
162nd/ 347
METRIC RANK
47.0%
BACHELOR'S DEGREE
100.0/ 100
METRIC RATING
22nd/ 347
METRIC RANK
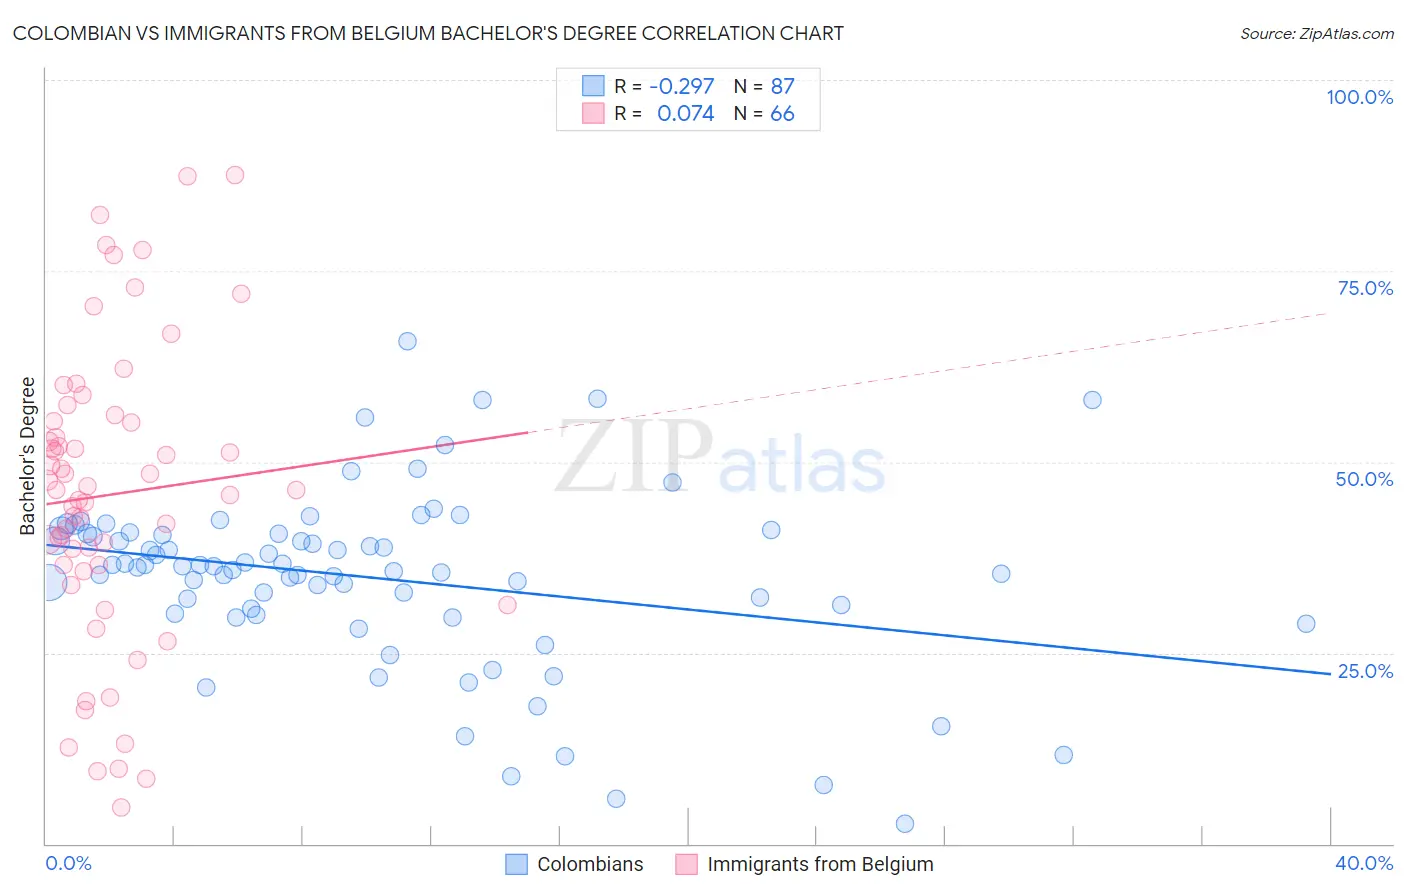
Colombian vs Immigrants from Belgium Bachelor's Degree Correlation Chart
The statistical analysis conducted on geographies consisting of 419,636,892 people shows a weak negative correlation between the proportion of Colombians and percentage of population with at least bachelor's degree education in the United States with a correlation coefficient (R) of -0.297 and weighted average of 38.4%. Similarly, the statistical analysis conducted on geographies consisting of 146,728,237 people shows a slight positive correlation between the proportion of Immigrants from Belgium and percentage of population with at least bachelor's degree education in the United States with a correlation coefficient (R) of 0.074 and weighted average of 47.0%, a difference of 22.5%.
Bachelor's Degree Correlation Summary
| Measurement | Colombian | Immigrants from Belgium |
| Minimum | 2.6% | 4.8% |
| Maximum | 65.8% | 87.6% |
| Range | 63.3% | 82.8% |
| Mean | 34.8% | 45.7% |
| Median | 36.4% | 46.3% |
| Interquartile 25% (IQ1) | 30.1% | 36.5% |
| Interquartile 75% (IQ3) | 40.6% | 55.4% |
| Interquartile Range (IQR) | 10.5% | 18.9% |
| Standard Deviation (Sample) | 11.6% | 19.4% |
| Standard Deviation (Population) | 11.6% | 19.2% |
Similar Demographics by Bachelor's Degree
Demographics Similar to Colombians by Bachelor's Degree
In terms of bachelor's degree, the demographic groups most similar to Colombians are Uruguayan (38.4%, a difference of 0.080%), Vietnamese (38.5%, a difference of 0.16%), Chinese (38.5%, a difference of 0.17%), Peruvian (38.3%, a difference of 0.17%), and Hungarian (38.3%, a difference of 0.31%).
| Demographics | Rating | Rank | Bachelor's Degree |
| Immigrants | Kenya | 73.8 /100 | #155 | Good 38.8% |
| Kenyans | 72.5 /100 | #156 | Good 38.7% |
| Immigrants | South America | 70.1 /100 | #157 | Good 38.6% |
| Immigrants | Germany | 69.6 /100 | #158 | Good 38.6% |
| Chinese | 66.6 /100 | #159 | Good 38.5% |
| Vietnamese | 66.6 /100 | #160 | Good 38.5% |
| Uruguayans | 65.8 /100 | #161 | Good 38.4% |
| Colombians | 65.0 /100 | #162 | Good 38.4% |
| Peruvians | 63.4 /100 | #163 | Good 38.3% |
| Hungarians | 62.1 /100 | #164 | Good 38.3% |
| Sri Lankans | 59.1 /100 | #165 | Average 38.2% |
| Somalis | 58.6 /100 | #166 | Average 38.1% |
| Scottish | 56.6 /100 | #167 | Average 38.1% |
| Danes | 56.2 /100 | #168 | Average 38.1% |
| Ghanaians | 55.3 /100 | #169 | Average 38.0% |
Demographics Similar to Immigrants from Belgium by Bachelor's Degree
In terms of bachelor's degree, the demographic groups most similar to Immigrants from Belgium are Immigrants from Sweden (47.0%, a difference of 0.090%), Immigrants from Korea (47.0%, a difference of 0.13%), Immigrants from Ireland (47.1%, a difference of 0.20%), Immigrants from Switzerland (47.1%, a difference of 0.21%), and Burmese (46.9%, a difference of 0.35%).
| Demographics | Rating | Rank | Bachelor's Degree |
| Immigrants | Eastern Asia | 100.0 /100 | #15 | Exceptional 48.1% |
| Soviet Union | 100.0 /100 | #16 | Exceptional 47.9% |
| Eastern Europeans | 100.0 /100 | #17 | Exceptional 47.5% |
| Indians (Asian) | 100.0 /100 | #18 | Exceptional 47.4% |
| Cambodians | 100.0 /100 | #19 | Exceptional 47.2% |
| Immigrants | Switzerland | 100.0 /100 | #20 | Exceptional 47.1% |
| Immigrants | Ireland | 100.0 /100 | #21 | Exceptional 47.1% |
| Immigrants | Belgium | 100.0 /100 | #22 | Exceptional 47.0% |
| Immigrants | Sweden | 100.0 /100 | #23 | Exceptional 47.0% |
| Immigrants | Korea | 100.0 /100 | #24 | Exceptional 47.0% |
| Burmese | 100.0 /100 | #25 | Exceptional 46.9% |
| Immigrants | Japan | 100.0 /100 | #26 | Exceptional 46.8% |
| Immigrants | France | 100.0 /100 | #27 | Exceptional 46.4% |
| Turks | 100.0 /100 | #28 | Exceptional 46.2% |
| Israelis | 100.0 /100 | #29 | Exceptional 46.1% |