Dutch vs Norwegian College, Under 1 year
COMPARE
Dutch
Norwegian
College, Under 1 year
College, Under 1 year Comparison
Dutch
Norwegians
65.3%
COLLEGE, UNDER 1 YEAR
46.1/ 100
METRIC RATING
180th/ 347
METRIC RANK
68.4%
COLLEGE, UNDER 1 YEAR
98.4/ 100
METRIC RATING
82nd/ 347
METRIC RANK
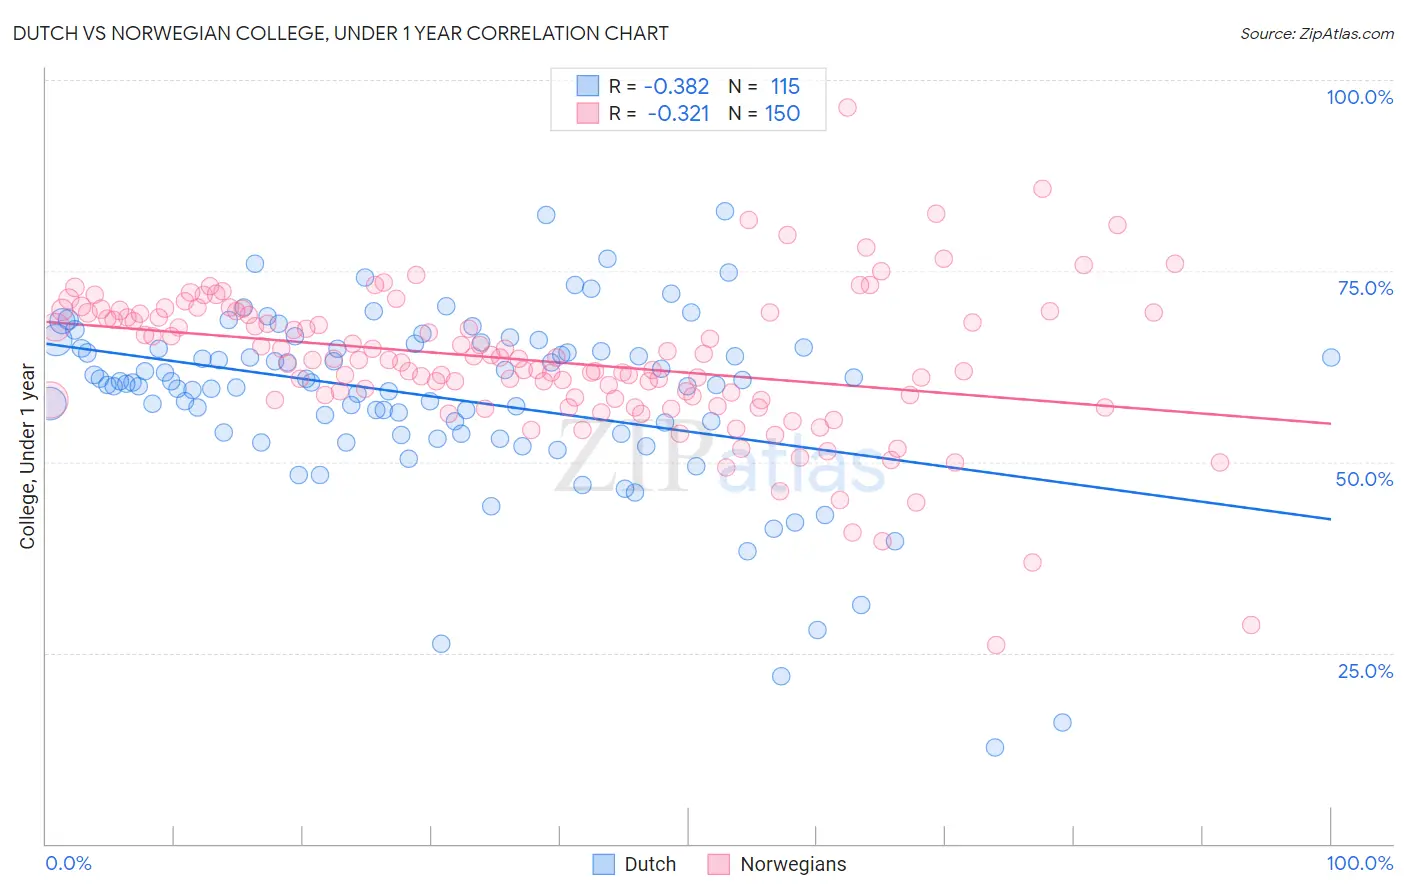
Dutch vs Norwegian College, Under 1 year Correlation Chart
The statistical analysis conducted on geographies consisting of 554,354,714 people shows a mild negative correlation between the proportion of Dutch and percentage of population with at least college, under 1 year education in the United States with a correlation coefficient (R) of -0.382 and weighted average of 65.3%. Similarly, the statistical analysis conducted on geographies consisting of 533,391,768 people shows a mild negative correlation between the proportion of Norwegians and percentage of population with at least college, under 1 year education in the United States with a correlation coefficient (R) of -0.321 and weighted average of 68.4%, a difference of 4.7%.
College, Under 1 year Correlation Summary
| Measurement | Dutch | Norwegian |
| Minimum | 12.6% | 26.1% |
| Maximum | 82.8% | 96.4% |
| Range | 70.1% | 70.3% |
| Mean | 58.4% | 63.2% |
| Median | 60.4% | 63.4% |
| Interquartile 25% (IQ1) | 53.7% | 58.2% |
| Interquartile 75% (IQ3) | 64.8% | 69.6% |
| Interquartile Range (IQR) | 11.1% | 11.3% |
| Standard Deviation (Sample) | 11.9% | 9.7% |
| Standard Deviation (Population) | 11.8% | 9.7% |
Similar Demographics by College, Under 1 year
Demographics Similar to Dutch by College, Under 1 year
In terms of college, under 1 year, the demographic groups most similar to Dutch are Spaniard (65.3%, a difference of 0.030%), Immigrants from Africa (65.3%, a difference of 0.060%), Guamanian/Chamorro (65.4%, a difference of 0.090%), German Russian (65.4%, a difference of 0.10%), and Immigrants from North Macedonia (65.4%, a difference of 0.11%).
| Demographics | Rating | Rank | College, Under 1 year |
| Swiss | 53.9 /100 | #173 | Average 65.5% |
| Immigrants | Bosnia and Herzegovina | 50.0 /100 | #174 | Average 65.4% |
| Scotch-Irish | 49.5 /100 | #175 | Average 65.4% |
| French | 48.9 /100 | #176 | Average 65.4% |
| Immigrants | North Macedonia | 48.6 /100 | #177 | Average 65.4% |
| German Russians | 48.3 /100 | #178 | Average 65.4% |
| Guamanians/Chamorros | 48.2 /100 | #179 | Average 65.4% |
| Dutch | 46.1 /100 | #180 | Average 65.3% |
| Spaniards | 45.5 /100 | #181 | Average 65.3% |
| Immigrants | Africa | 44.7 /100 | #182 | Average 65.3% |
| Immigrants | Poland | 42.6 /100 | #183 | Average 65.2% |
| Bermudans | 42.0 /100 | #184 | Average 65.2% |
| Sri Lankans | 41.7 /100 | #185 | Average 65.2% |
| Immigrants | Sierra Leone | 39.7 /100 | #186 | Fair 65.1% |
| Immigrants | Southern Europe | 34.3 /100 | #187 | Fair 64.9% |
Demographics Similar to Norwegians by College, Under 1 year
In terms of college, under 1 year, the demographic groups most similar to Norwegians are Argentinean (68.4%, a difference of 0.020%), Immigrants from Hungary (68.3%, a difference of 0.040%), Egyptian (68.3%, a difference of 0.040%), Immigrants from Greece (68.4%, a difference of 0.050%), and Immigrants from Lebanon (68.3%, a difference of 0.050%).
| Demographics | Rating | Rank | College, Under 1 year |
| Immigrants | Western Europe | 98.6 /100 | #75 | Exceptional 68.5% |
| Laotians | 98.6 /100 | #76 | Exceptional 68.5% |
| British | 98.6 /100 | #77 | Exceptional 68.5% |
| Danes | 98.6 /100 | #78 | Exceptional 68.5% |
| Greeks | 98.6 /100 | #79 | Exceptional 68.5% |
| Immigrants | Spain | 98.5 /100 | #80 | Exceptional 68.4% |
| Immigrants | Greece | 98.5 /100 | #81 | Exceptional 68.4% |
| Norwegians | 98.4 /100 | #82 | Exceptional 68.4% |
| Argentineans | 98.4 /100 | #83 | Exceptional 68.4% |
| Immigrants | Hungary | 98.3 /100 | #84 | Exceptional 68.3% |
| Egyptians | 98.3 /100 | #85 | Exceptional 68.3% |
| Immigrants | Lebanon | 98.3 /100 | #86 | Exceptional 68.3% |
| Chinese | 98.3 /100 | #87 | Exceptional 68.3% |
| Croatians | 98.2 /100 | #88 | Exceptional 68.3% |
| Ethiopians | 98.2 /100 | #89 | Exceptional 68.3% |