Yakama vs Immigrants from Cameroon 10th Grade
COMPARE
Yakama
Immigrants from Cameroon
10th Grade
10th Grade Comparison
Yakama
Immigrants from Cameroon
86.9%
10TH GRADE
0.0/ 100
METRIC RATING
343rd/ 347
METRIC RANK
93.0%
10TH GRADE
2.6/ 100
METRIC RATING
242nd/ 347
METRIC RANK
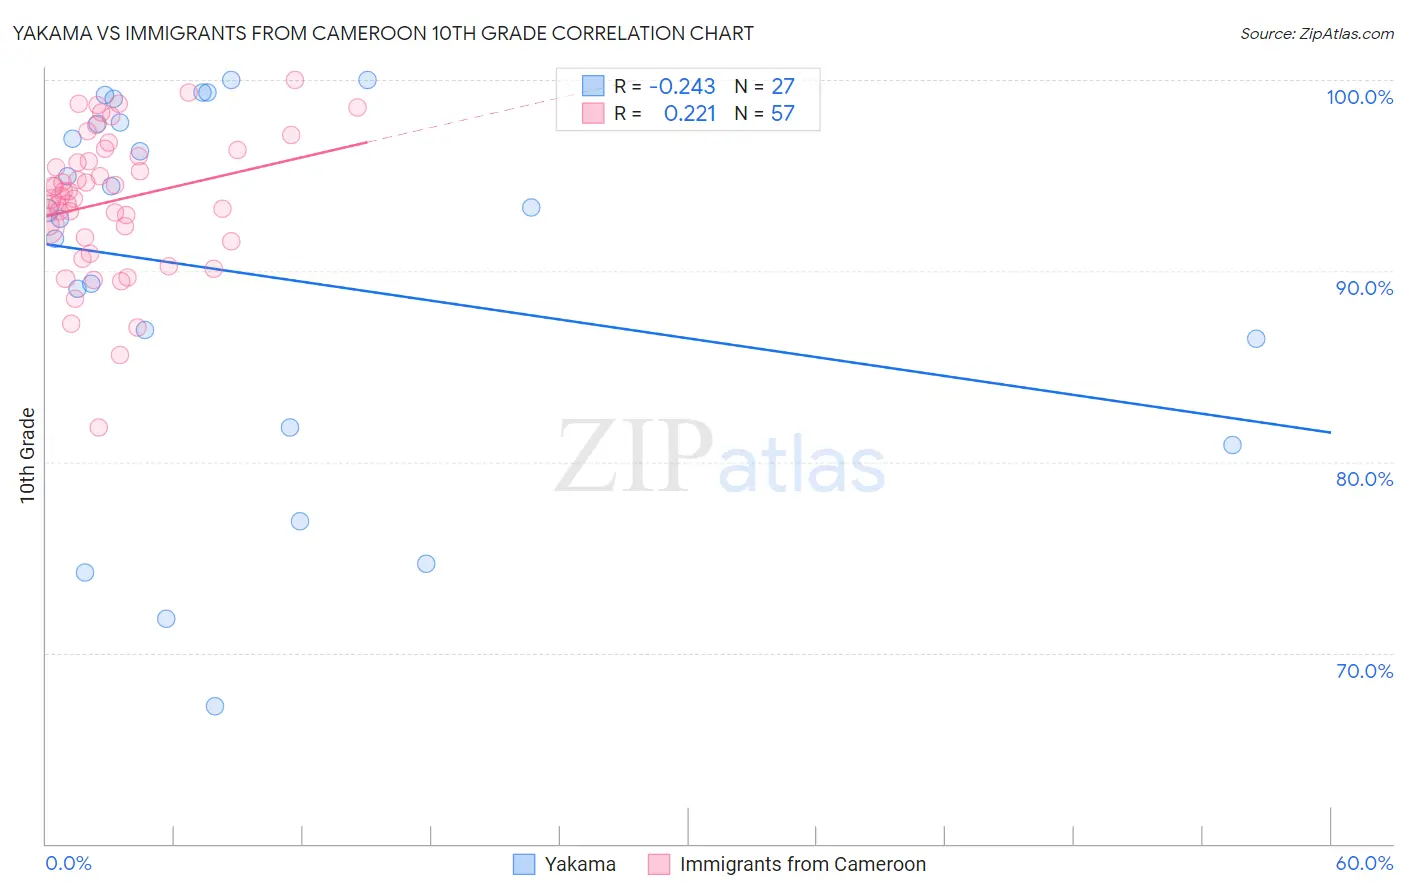
Yakama vs Immigrants from Cameroon 10th Grade Correlation Chart
The statistical analysis conducted on geographies consisting of 19,923,144 people shows a weak negative correlation between the proportion of Yakama and percentage of population with at least 10th grade education in the United States with a correlation coefficient (R) of -0.243 and weighted average of 86.9%. Similarly, the statistical analysis conducted on geographies consisting of 130,618,704 people shows a weak positive correlation between the proportion of Immigrants from Cameroon and percentage of population with at least 10th grade education in the United States with a correlation coefficient (R) of 0.221 and weighted average of 93.0%, a difference of 7.0%.
10th Grade Correlation Summary
| Measurement | Yakama | Immigrants from Cameroon |
| Minimum | 67.2% | 81.8% |
| Maximum | 100.0% | 100.0% |
| Range | 32.8% | 18.2% |
| Mean | 89.8% | 93.7% |
| Median | 93.2% | 93.9% |
| Interquartile 25% (IQ1) | 81.8% | 91.6% |
| Interquartile 75% (IQ3) | 97.8% | 96.2% |
| Interquartile Range (IQR) | 16.0% | 4.6% |
| Standard Deviation (Sample) | 9.8% | 3.7% |
| Standard Deviation (Population) | 9.6% | 3.6% |
Similar Demographics by 10th Grade
Demographics Similar to Yakama by 10th Grade
In terms of 10th grade, the demographic groups most similar to Yakama are Immigrants from El Salvador (86.8%, a difference of 0.14%), Immigrants from Central America (86.6%, a difference of 0.32%), Immigrants from Guatemala (87.4%, a difference of 0.58%), Salvadoran (87.5%, a difference of 0.74%), and Spanish American Indian (86.2%, a difference of 0.77%).
| Demographics | Rating | Rank | 10th Grade |
| Hondurans | 0.0 /100 | #333 | Tragic 89.0% |
| Hispanics or Latinos | 0.0 /100 | #334 | Tragic 88.9% |
| Immigrants | Dominican Republic | 0.0 /100 | #335 | Tragic 88.7% |
| Immigrants | Honduras | 0.0 /100 | #336 | Tragic 88.5% |
| Central Americans | 0.0 /100 | #337 | Tragic 88.4% |
| Immigrants | Latin America | 0.0 /100 | #338 | Tragic 88.3% |
| Guatemalans | 0.0 /100 | #339 | Tragic 87.9% |
| Mexicans | 0.0 /100 | #340 | Tragic 87.8% |
| Salvadorans | 0.0 /100 | #341 | Tragic 87.5% |
| Immigrants | Guatemala | 0.0 /100 | #342 | Tragic 87.4% |
| Yakama | 0.0 /100 | #343 | Tragic 86.9% |
| Immigrants | El Salvador | 0.0 /100 | #344 | Tragic 86.8% |
| Immigrants | Central America | 0.0 /100 | #345 | Tragic 86.6% |
| Spanish American Indians | 0.0 /100 | #346 | Tragic 86.2% |
| Immigrants | Mexico | 0.0 /100 | #347 | Tragic 86.2% |
Demographics Similar to Immigrants from Cameroon by 10th Grade
In terms of 10th grade, the demographic groups most similar to Immigrants from Cameroon are Immigrants from Somalia (93.0%, a difference of 0.0%), Senegalese (93.0%, a difference of 0.020%), Spanish American (92.9%, a difference of 0.050%), Uruguayan (92.9%, a difference of 0.080%), and Immigrants from Middle Africa (92.9%, a difference of 0.10%).
| Demographics | Rating | Rank | 10th Grade |
| Africans | 4.6 /100 | #235 | Tragic 93.1% |
| Afghans | 4.5 /100 | #236 | Tragic 93.1% |
| Immigrants | Panama | 4.3 /100 | #237 | Tragic 93.1% |
| Nigerians | 4.2 /100 | #238 | Tragic 93.1% |
| Costa Ricans | 4.2 /100 | #239 | Tragic 93.1% |
| Immigrants | Hong Kong | 4.2 /100 | #240 | Tragic 93.1% |
| Immigrants | Somalia | 2.7 /100 | #241 | Tragic 93.0% |
| Immigrants | Cameroon | 2.6 /100 | #242 | Tragic 93.0% |
| Senegalese | 2.4 /100 | #243 | Tragic 93.0% |
| Spanish Americans | 2.1 /100 | #244 | Tragic 92.9% |
| Uruguayans | 1.8 /100 | #245 | Tragic 92.9% |
| Immigrants | Middle Africa | 1.7 /100 | #246 | Tragic 92.9% |
| Immigrants | Afghanistan | 1.4 /100 | #247 | Tragic 92.8% |
| Colombians | 1.4 /100 | #248 | Tragic 92.8% |
| Immigrants | Senegal | 1.4 /100 | #249 | Tragic 92.8% |