Yakama vs Comanche 1st Grade
COMPARE
Yakama
Comanche
1st Grade
1st Grade Comparison
Yakama
Comanche
96.5%
1ST GRADE
0.0/ 100
METRIC RATING
335th/ 347
METRIC RANK
98.0%
1ST GRADE
66.9/ 100
METRIC RATING
155th/ 347
METRIC RANK
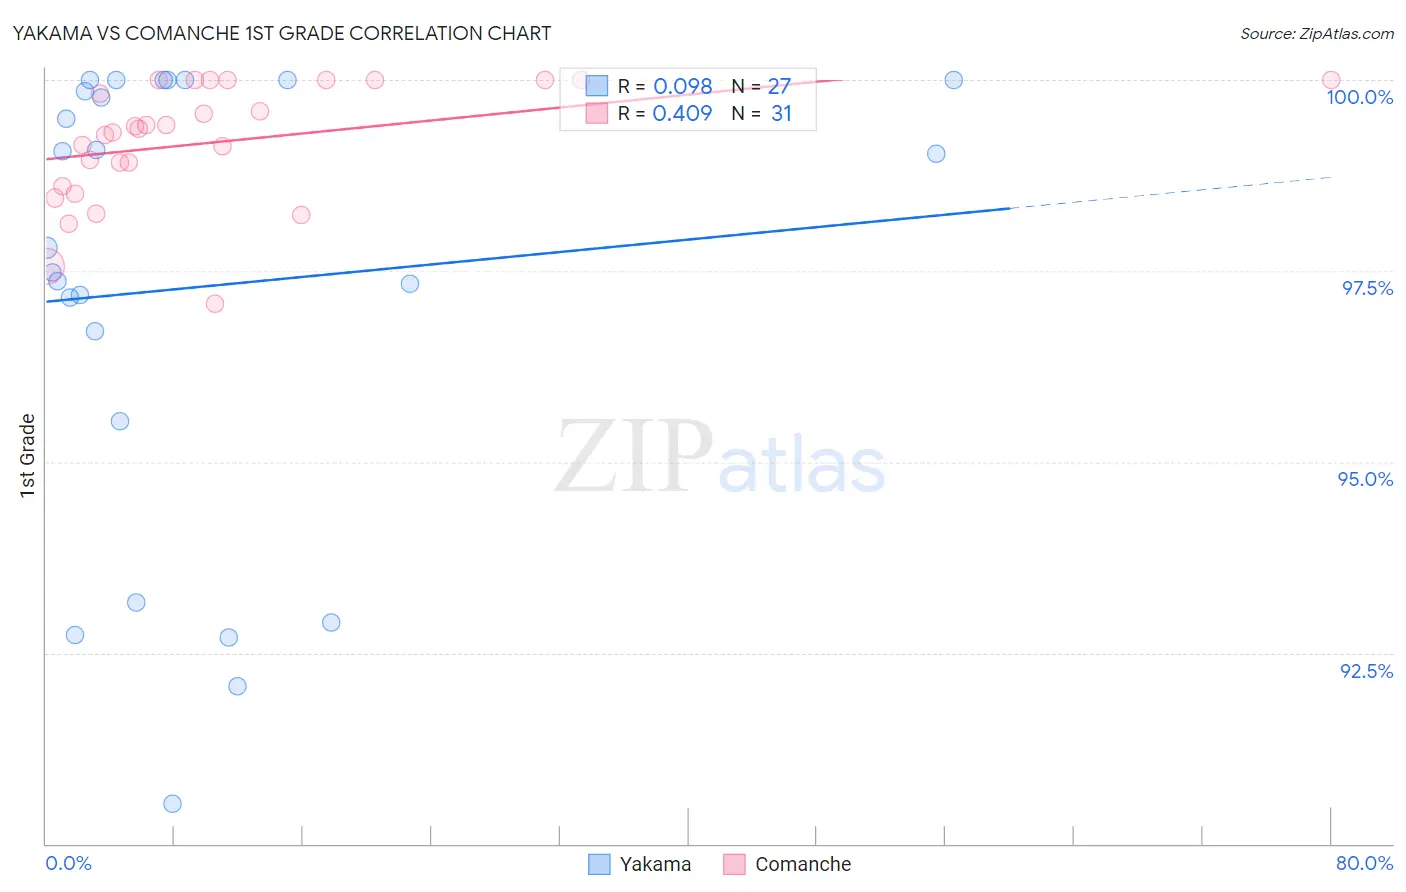
Yakama vs Comanche 1st Grade Correlation Chart
The statistical analysis conducted on geographies consisting of 19,923,144 people shows a slight positive correlation between the proportion of Yakama and percentage of population with at least 1st grade education in the United States with a correlation coefficient (R) of 0.098 and weighted average of 96.5%. Similarly, the statistical analysis conducted on geographies consisting of 109,786,530 people shows a moderate positive correlation between the proportion of Comanche and percentage of population with at least 1st grade education in the United States with a correlation coefficient (R) of 0.409 and weighted average of 98.0%, a difference of 1.5%.
1st Grade Correlation Summary
| Measurement | Yakama | Comanche |
| Minimum | 90.5% | 97.1% |
| Maximum | 100.0% | 100.0% |
| Range | 9.5% | 2.9% |
| Mean | 97.3% | 99.2% |
| Median | 97.8% | 99.4% |
| Interquartile 25% (IQ1) | 95.5% | 98.6% |
| Interquartile 75% (IQ3) | 100.0% | 100.0% |
| Interquartile Range (IQR) | 4.5% | 1.4% |
| Standard Deviation (Sample) | 3.0% | 0.78% |
| Standard Deviation (Population) | 2.9% | 0.77% |
Similar Demographics by 1st Grade
Demographics Similar to Yakama by 1st Grade
In terms of 1st grade, the demographic groups most similar to Yakama are Immigrants from Dominican Republic (96.5%, a difference of 0.020%), Bangladeshi (96.5%, a difference of 0.020%), Guatemalan (96.5%, a difference of 0.020%), Central American (96.5%, a difference of 0.040%), and Immigrants from Cambodia (96.5%, a difference of 0.060%).
| Demographics | Rating | Rank | 1st Grade |
| Immigrants | Latin America | 0.0 /100 | #328 | Tragic 96.7% |
| Japanese | 0.0 /100 | #329 | Tragic 96.6% |
| Immigrants | Vietnam | 0.0 /100 | #330 | Tragic 96.6% |
| Immigrants | Armenia | 0.0 /100 | #331 | Tragic 96.6% |
| Central Americans | 0.0 /100 | #332 | Tragic 96.5% |
| Immigrants | Dominican Republic | 0.0 /100 | #333 | Tragic 96.5% |
| Bangladeshis | 0.0 /100 | #334 | Tragic 96.5% |
| Yakama | 0.0 /100 | #335 | Tragic 96.5% |
| Guatemalans | 0.0 /100 | #336 | Tragic 96.5% |
| Immigrants | Cambodia | 0.0 /100 | #337 | Tragic 96.5% |
| Immigrants | Fiji | 0.0 /100 | #338 | Tragic 96.4% |
| Immigrants | Guatemala | 0.0 /100 | #339 | Tragic 96.4% |
| Immigrants | Cabo Verde | 0.0 /100 | #340 | Tragic 96.3% |
| Immigrants | Central America | 0.0 /100 | #341 | Tragic 96.3% |
| Immigrants | Mexico | 0.0 /100 | #342 | Tragic 96.3% |
Demographics Similar to Comanche by 1st Grade
In terms of 1st grade, the demographic groups most similar to Comanche are Immigrants from Iran (98.0%, a difference of 0.0%), Immigrants from South Central Asia (98.0%, a difference of 0.0%), Dutch West Indian (98.0%, a difference of 0.010%), Immigrants from Moldova (98.0%, a difference of 0.010%), and Soviet Union (98.0%, a difference of 0.010%).
| Demographics | Rating | Rank | 1st Grade |
| Apache | 75.2 /100 | #148 | Good 98.0% |
| Immigrants | Greece | 74.9 /100 | #149 | Good 98.0% |
| Jordanians | 72.7 /100 | #150 | Good 98.0% |
| Dutch West Indians | 69.8 /100 | #151 | Good 98.0% |
| Immigrants | Moldova | 69.5 /100 | #152 | Good 98.0% |
| Soviet Union | 68.9 /100 | #153 | Good 98.0% |
| Immigrants | Iran | 66.9 /100 | #154 | Good 98.0% |
| Comanche | 66.9 /100 | #155 | Good 98.0% |
| Immigrants | South Central Asia | 66.2 /100 | #156 | Good 98.0% |
| Immigrants | North Macedonia | 65.3 /100 | #157 | Good 98.0% |
| Venezuelans | 64.7 /100 | #158 | Good 98.0% |
| French American Indians | 63.7 /100 | #159 | Good 98.0% |
| Immigrants | Russia | 59.2 /100 | #160 | Average 97.9% |
| Immigrants | Italy | 59.1 /100 | #161 | Average 97.9% |
| Immigrants | Eastern Europe | 58.9 /100 | #162 | Average 97.9% |