Iranian vs Immigrants from Grenada 1st Grade
COMPARE
Iranian
Immigrants from Grenada
1st Grade
1st Grade Comparison
Iranians
Immigrants from Grenada
98.2%
1ST GRADE
96.0/ 100
METRIC RATING
115th/ 347
METRIC RANK
97.2%
1ST GRADE
0.0/ 100
METRIC RATING
294th/ 347
METRIC RANK
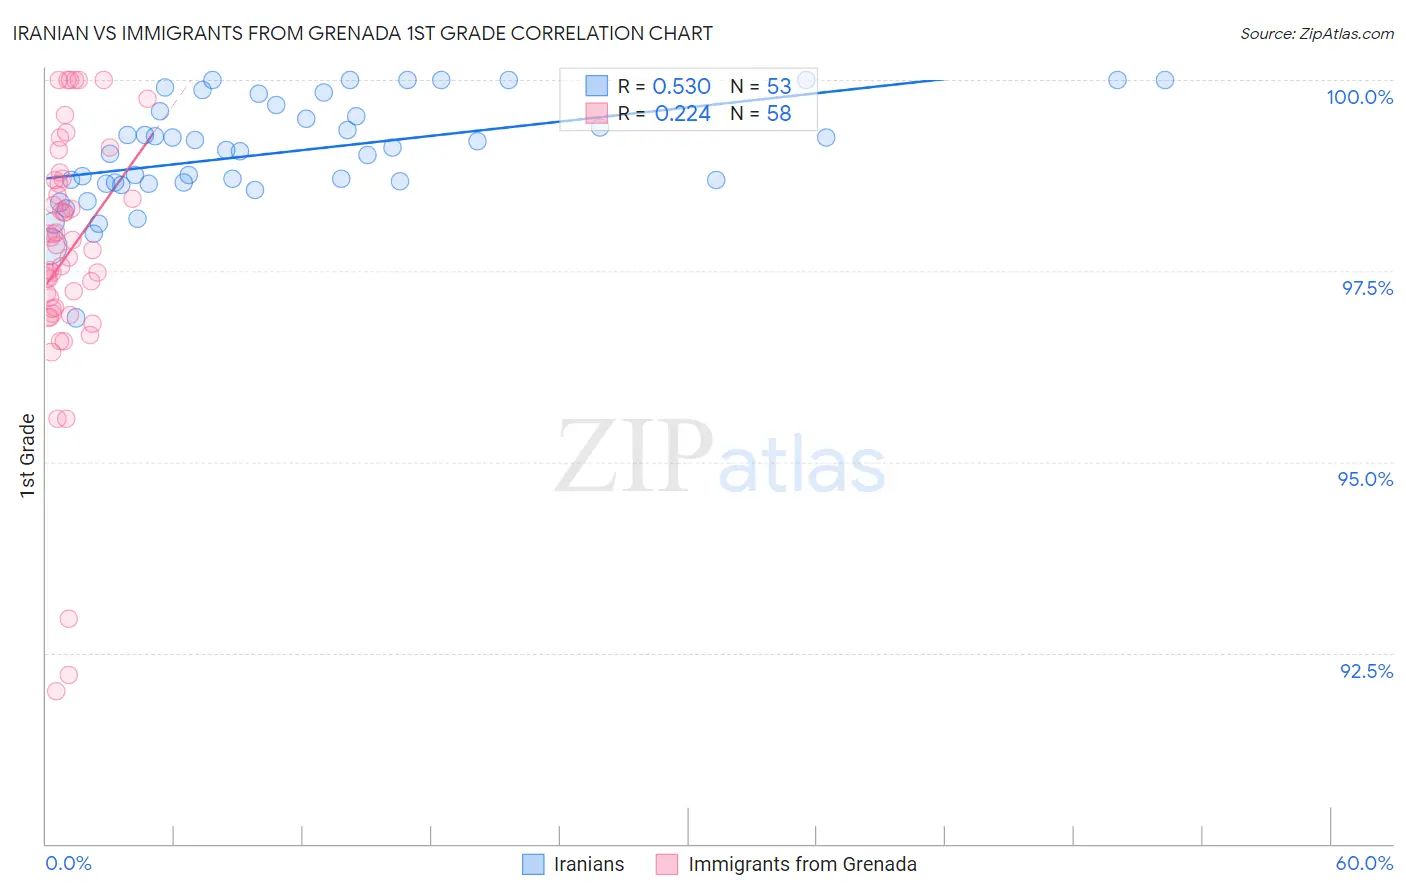
Iranian vs Immigrants from Grenada 1st Grade Correlation Chart
The statistical analysis conducted on geographies consisting of 316,902,340 people shows a substantial positive correlation between the proportion of Iranians and percentage of population with at least 1st grade education in the United States with a correlation coefficient (R) of 0.530 and weighted average of 98.2%. Similarly, the statistical analysis conducted on geographies consisting of 67,200,336 people shows a weak positive correlation between the proportion of Immigrants from Grenada and percentage of population with at least 1st grade education in the United States with a correlation coefficient (R) of 0.224 and weighted average of 97.2%, a difference of 1.0%.
1st Grade Correlation Summary
| Measurement | Iranian | Immigrants from Grenada |
| Minimum | 96.9% | 92.0% |
| Maximum | 100.0% | 100.0% |
| Range | 3.1% | 8.0% |
| Mean | 99.1% | 97.7% |
| Median | 99.1% | 97.8% |
| Interquartile 25% (IQ1) | 98.7% | 97.0% |
| Interquartile 75% (IQ3) | 99.6% | 98.7% |
| Interquartile Range (IQR) | 0.98% | 1.7% |
| Standard Deviation (Sample) | 0.69% | 1.7% |
| Standard Deviation (Population) | 0.68% | 1.7% |
Similar Demographics by 1st Grade
Demographics Similar to Iranians by 1st Grade
In terms of 1st grade, the demographic groups most similar to Iranians are Ute (98.2%, a difference of 0.0%), Spanish (98.2%, a difference of 0.0%), Immigrants from Singapore (98.2%, a difference of 0.010%), Immigrants from Czechoslovakia (98.2%, a difference of 0.010%), and Immigrants from Norway (98.2%, a difference of 0.010%).
| Demographics | Rating | Rank | 1st Grade |
| Bhutanese | 97.3 /100 | #108 | Exceptional 98.2% |
| German Russians | 97.1 /100 | #109 | Exceptional 98.2% |
| Immigrants | Singapore | 96.7 /100 | #110 | Exceptional 98.2% |
| Immigrants | Czechoslovakia | 96.6 /100 | #111 | Exceptional 98.2% |
| Immigrants | Norway | 96.6 /100 | #112 | Exceptional 98.2% |
| Immigrants | Latvia | 96.4 /100 | #113 | Exceptional 98.2% |
| Ute | 96.2 /100 | #114 | Exceptional 98.2% |
| Iranians | 96.0 /100 | #115 | Exceptional 98.2% |
| Spanish | 95.9 /100 | #116 | Exceptional 98.2% |
| Yugoslavians | 95.5 /100 | #117 | Exceptional 98.2% |
| Immigrants | France | 95.5 /100 | #118 | Exceptional 98.2% |
| Thais | 94.7 /100 | #119 | Exceptional 98.1% |
| Okinawans | 94.5 /100 | #120 | Exceptional 98.1% |
| Immigrants | Zimbabwe | 94.0 /100 | #121 | Exceptional 98.1% |
| Menominee | 93.9 /100 | #122 | Exceptional 98.1% |
Demographics Similar to Immigrants from Grenada by 1st Grade
In terms of 1st grade, the demographic groups most similar to Immigrants from Grenada are Immigrants (97.2%, a difference of 0.010%), Immigrants from Eritrea (97.2%, a difference of 0.010%), Malaysian (97.2%, a difference of 0.020%), British West Indian (97.2%, a difference of 0.040%), and Houma (97.2%, a difference of 0.060%).
| Demographics | Rating | Rank | 1st Grade |
| Immigrants | Hong Kong | 0.0 /100 | #287 | Tragic 97.3% |
| Immigrants | Thailand | 0.0 /100 | #288 | Tragic 97.3% |
| Immigrants | Afghanistan | 0.0 /100 | #289 | Tragic 97.3% |
| Immigrants | St. Vincent and the Grenadines | 0.0 /100 | #290 | Tragic 97.3% |
| Houma | 0.0 /100 | #291 | Tragic 97.2% |
| British West Indians | 0.0 /100 | #292 | Tragic 97.2% |
| Malaysians | 0.0 /100 | #293 | Tragic 97.2% |
| Immigrants | Grenada | 0.0 /100 | #294 | Tragic 97.2% |
| Immigrants | Immigrants | 0.0 /100 | #295 | Tragic 97.2% |
| Immigrants | Eritrea | 0.0 /100 | #296 | Tragic 97.2% |
| Central American Indians | 0.0 /100 | #297 | Tragic 97.1% |
| Immigrants | Dominica | 0.0 /100 | #298 | Tragic 97.1% |
| Immigrants | Cuba | 0.0 /100 | #299 | Tragic 97.1% |
| Haitians | 0.0 /100 | #300 | Tragic 97.1% |
| Immigrants | South Eastern Asia | 0.0 /100 | #301 | Tragic 97.1% |