Yakama vs Immigrants from Belarus 11th Grade
COMPARE
Yakama
Immigrants from Belarus
11th Grade
11th Grade Comparison
Yakama
Immigrants from Belarus
85.0%
11TH GRADE
0.0/ 100
METRIC RATING
344th/ 347
METRIC RANK
93.3%
11TH GRADE
96.3/ 100
METRIC RATING
122nd/ 347
METRIC RANK
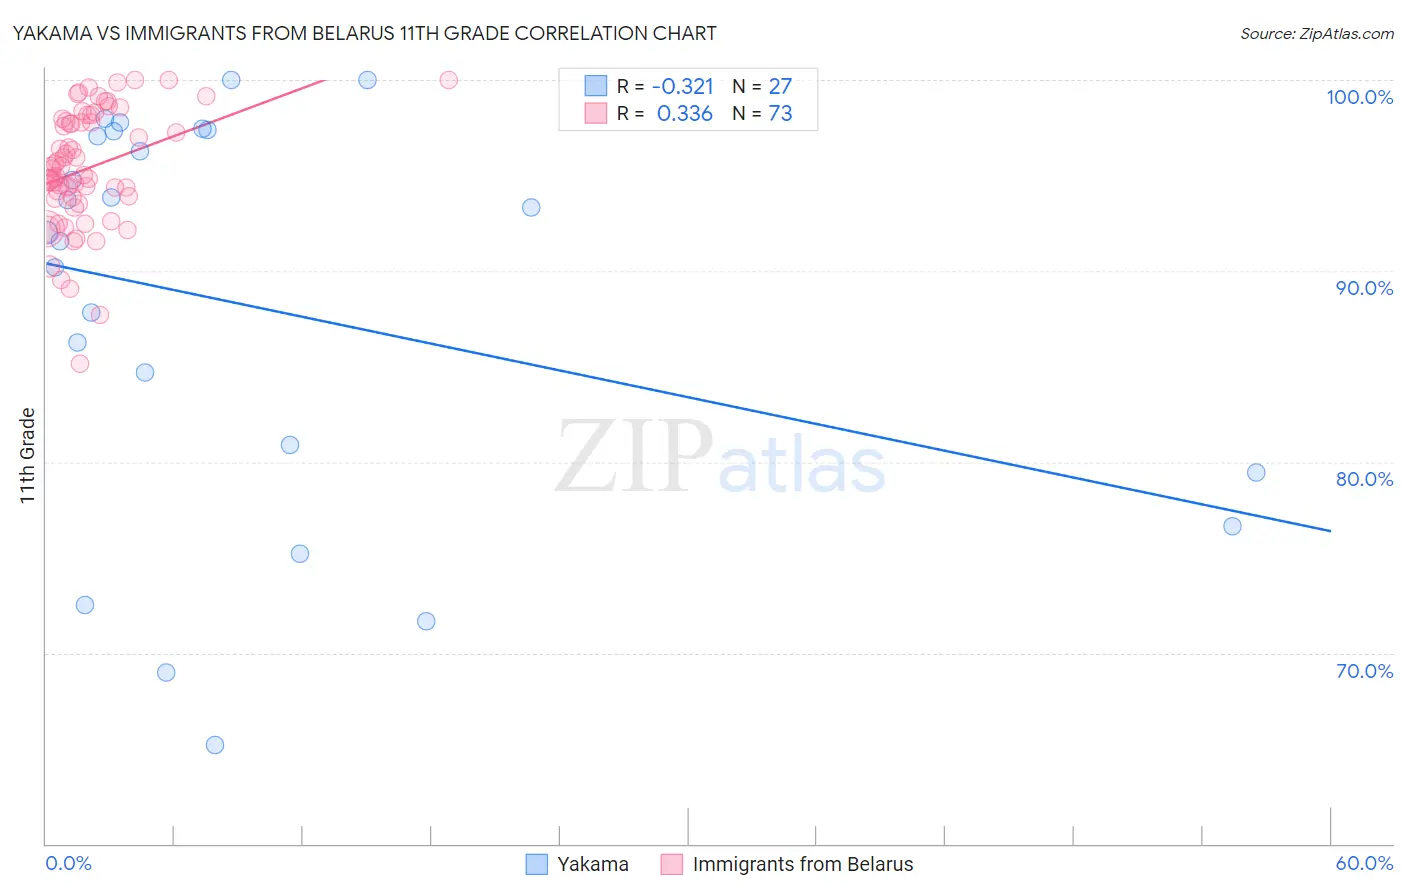
Yakama vs Immigrants from Belarus 11th Grade Correlation Chart
The statistical analysis conducted on geographies consisting of 19,923,144 people shows a mild negative correlation between the proportion of Yakama and percentage of population with at least 11th grade education in the United States with a correlation coefficient (R) of -0.321 and weighted average of 85.0%. Similarly, the statistical analysis conducted on geographies consisting of 150,125,045 people shows a mild positive correlation between the proportion of Immigrants from Belarus and percentage of population with at least 11th grade education in the United States with a correlation coefficient (R) of 0.336 and weighted average of 93.3%, a difference of 9.8%.
11th Grade Correlation Summary
| Measurement | Yakama | Immigrants from Belarus |
| Minimum | 65.2% | 85.2% |
| Maximum | 100.0% | 100.0% |
| Range | 34.8% | 14.8% |
| Mean | 88.1% | 95.4% |
| Median | 92.0% | 95.3% |
| Interquartile 25% (IQ1) | 79.5% | 93.8% |
| Interquartile 75% (IQ3) | 97.3% | 97.9% |
| Interquartile Range (IQR) | 17.9% | 4.1% |
| Standard Deviation (Sample) | 10.5% | 3.1% |
| Standard Deviation (Population) | 10.3% | 3.1% |
Similar Demographics by 11th Grade
Demographics Similar to Yakama by 11th Grade
In terms of 11th grade, the demographic groups most similar to Yakama are Immigrants from Central America (84.9%, a difference of 0.030%), Spanish American Indian (84.7%, a difference of 0.27%), Immigrants from El Salvador (85.3%, a difference of 0.40%), Immigrants from Mexico (84.5%, a difference of 0.57%), and Immigrants from Guatemala (85.8%, a difference of 1.0%).
| Demographics | Rating | Rank | 11th Grade |
| Immigrants | Yemen | 0.0 /100 | #333 | Tragic 87.1% |
| Houma | 0.0 /100 | #334 | Tragic 87.0% |
| Central Americans | 0.0 /100 | #335 | Tragic 86.9% |
| Immigrants | Dominican Republic | 0.0 /100 | #336 | Tragic 86.9% |
| Immigrants | Honduras | 0.0 /100 | #337 | Tragic 86.9% |
| Immigrants | Latin America | 0.0 /100 | #338 | Tragic 86.8% |
| Guatemalans | 0.0 /100 | #339 | Tragic 86.4% |
| Salvadorans | 0.0 /100 | #340 | Tragic 86.2% |
| Mexicans | 0.0 /100 | #341 | Tragic 86.1% |
| Immigrants | Guatemala | 0.0 /100 | #342 | Tragic 85.8% |
| Immigrants | El Salvador | 0.0 /100 | #343 | Tragic 85.3% |
| Yakama | 0.0 /100 | #344 | Tragic 85.0% |
| Immigrants | Central America | 0.0 /100 | #345 | Tragic 84.9% |
| Spanish American Indians | 0.0 /100 | #346 | Tragic 84.7% |
| Immigrants | Mexico | 0.0 /100 | #347 | Tragic 84.5% |
Demographics Similar to Immigrants from Belarus by 11th Grade
In terms of 11th grade, the demographic groups most similar to Immigrants from Belarus are German Russian (93.3%, a difference of 0.0%), Immigrants from Russia (93.3%, a difference of 0.020%), Immigrants from Greece (93.2%, a difference of 0.030%), Immigrants from Eastern Europe (93.2%, a difference of 0.030%), and Immigrants from Sri Lanka (93.2%, a difference of 0.040%).
| Demographics | Rating | Rank | 11th Grade |
| Palestinians | 97.7 /100 | #115 | Exceptional 93.4% |
| Immigrants | Hungary | 97.5 /100 | #116 | Exceptional 93.4% |
| Whites/Caucasians | 97.4 /100 | #117 | Exceptional 93.3% |
| Immigrants | Korea | 97.0 /100 | #118 | Exceptional 93.3% |
| Israelis | 97.0 /100 | #119 | Exceptional 93.3% |
| Immigrants | Russia | 96.6 /100 | #120 | Exceptional 93.3% |
| German Russians | 96.4 /100 | #121 | Exceptional 93.3% |
| Immigrants | Belarus | 96.3 /100 | #122 | Exceptional 93.3% |
| Immigrants | Greece | 95.9 /100 | #123 | Exceptional 93.2% |
| Immigrants | Eastern Europe | 95.9 /100 | #124 | Exceptional 93.2% |
| Immigrants | Sri Lanka | 95.6 /100 | #125 | Exceptional 93.2% |
| Basques | 95.2 /100 | #126 | Exceptional 93.2% |
| Immigrants | Kazakhstan | 92.4 /100 | #127 | Exceptional 93.1% |
| Immigrants | Jordan | 92.4 /100 | #128 | Exceptional 93.1% |
| Immigrants | Ukraine | 89.8 /100 | #129 | Excellent 93.0% |