Ute vs Immigrants from Belarus 11th Grade
COMPARE
Ute
Immigrants from Belarus
11th Grade
11th Grade Comparison
Ute
Immigrants from Belarus
91.1%
11TH GRADE
0.2/ 100
METRIC RATING
269th/ 347
METRIC RANK
93.3%
11TH GRADE
96.3/ 100
METRIC RATING
122nd/ 347
METRIC RANK
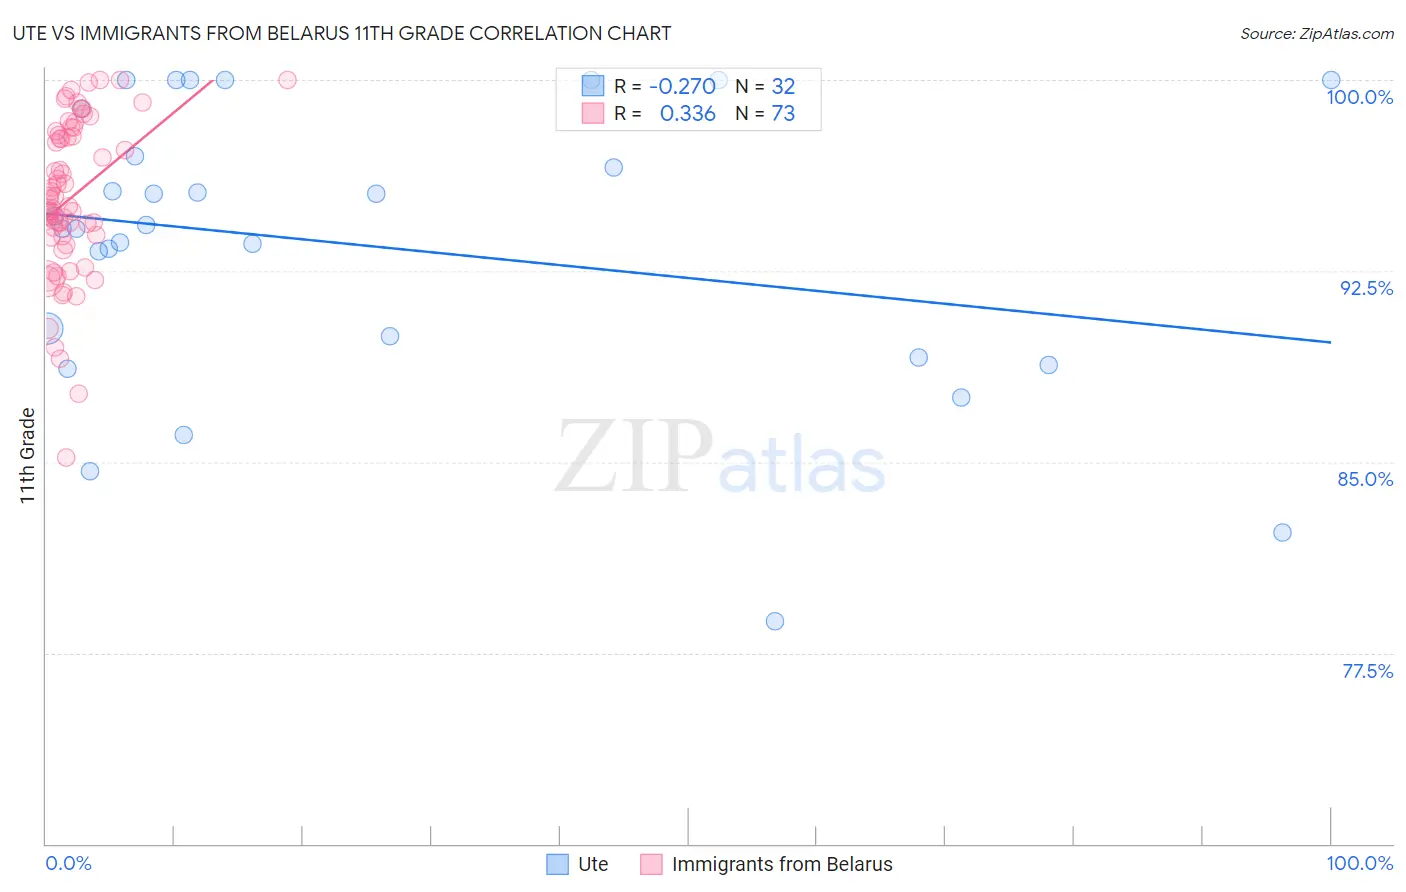
Ute vs Immigrants from Belarus 11th Grade Correlation Chart
The statistical analysis conducted on geographies consisting of 55,668,599 people shows a weak negative correlation between the proportion of Ute and percentage of population with at least 11th grade education in the United States with a correlation coefficient (R) of -0.270 and weighted average of 91.1%. Similarly, the statistical analysis conducted on geographies consisting of 150,125,045 people shows a mild positive correlation between the proportion of Immigrants from Belarus and percentage of population with at least 11th grade education in the United States with a correlation coefficient (R) of 0.336 and weighted average of 93.3%, a difference of 2.4%.
11th Grade Correlation Summary
| Measurement | Ute | Immigrants from Belarus |
| Minimum | 78.7% | 85.2% |
| Maximum | 100.0% | 100.0% |
| Range | 21.3% | 14.8% |
| Mean | 93.5% | 95.4% |
| Median | 94.2% | 95.3% |
| Interquartile 25% (IQ1) | 89.5% | 93.8% |
| Interquartile 75% (IQ3) | 98.0% | 97.9% |
| Interquartile Range (IQR) | 8.4% | 4.1% |
| Standard Deviation (Sample) | 5.6% | 3.1% |
| Standard Deviation (Population) | 5.5% | 3.1% |
Similar Demographics by 11th Grade
Demographics Similar to Ute by 11th Grade
In terms of 11th grade, the demographic groups most similar to Ute are U.S. Virgin Islander (91.1%, a difference of 0.030%), Trinidadian and Tobagonian (91.1%, a difference of 0.030%), Immigrants from Peru (91.0%, a difference of 0.060%), West Indian (91.0%, a difference of 0.060%), and Immigrants from Jamaica (91.2%, a difference of 0.10%).
| Demographics | Rating | Rank | 11th Grade |
| Immigrants | Uruguay | 0.5 /100 | #262 | Tragic 91.3% |
| Immigrants | Ghana | 0.3 /100 | #263 | Tragic 91.2% |
| Yup'ik | 0.3 /100 | #264 | Tragic 91.2% |
| Pueblo | 0.3 /100 | #265 | Tragic 91.2% |
| Immigrants | Western Africa | 0.3 /100 | #266 | Tragic 91.2% |
| Immigrants | Jamaica | 0.3 /100 | #267 | Tragic 91.2% |
| U.S. Virgin Islanders | 0.2 /100 | #268 | Tragic 91.1% |
| Ute | 0.2 /100 | #269 | Tragic 91.1% |
| Trinidadians and Tobagonians | 0.2 /100 | #270 | Tragic 91.1% |
| Immigrants | Peru | 0.1 /100 | #271 | Tragic 91.0% |
| West Indians | 0.1 /100 | #272 | Tragic 91.0% |
| Paiute | 0.1 /100 | #273 | Tragic 91.0% |
| Immigrants | Trinidad and Tobago | 0.1 /100 | #274 | Tragic 90.9% |
| Immigrants | South Eastern Asia | 0.1 /100 | #275 | Tragic 90.9% |
| Bangladeshis | 0.1 /100 | #276 | Tragic 90.9% |
Demographics Similar to Immigrants from Belarus by 11th Grade
In terms of 11th grade, the demographic groups most similar to Immigrants from Belarus are German Russian (93.3%, a difference of 0.0%), Immigrants from Russia (93.3%, a difference of 0.020%), Immigrants from Greece (93.2%, a difference of 0.030%), Immigrants from Eastern Europe (93.2%, a difference of 0.030%), and Immigrants from Sri Lanka (93.2%, a difference of 0.040%).
| Demographics | Rating | Rank | 11th Grade |
| Palestinians | 97.7 /100 | #115 | Exceptional 93.4% |
| Immigrants | Hungary | 97.5 /100 | #116 | Exceptional 93.4% |
| Whites/Caucasians | 97.4 /100 | #117 | Exceptional 93.3% |
| Immigrants | Korea | 97.0 /100 | #118 | Exceptional 93.3% |
| Israelis | 97.0 /100 | #119 | Exceptional 93.3% |
| Immigrants | Russia | 96.6 /100 | #120 | Exceptional 93.3% |
| German Russians | 96.4 /100 | #121 | Exceptional 93.3% |
| Immigrants | Belarus | 96.3 /100 | #122 | Exceptional 93.3% |
| Immigrants | Greece | 95.9 /100 | #123 | Exceptional 93.2% |
| Immigrants | Eastern Europe | 95.9 /100 | #124 | Exceptional 93.2% |
| Immigrants | Sri Lanka | 95.6 /100 | #125 | Exceptional 93.2% |
| Basques | 95.2 /100 | #126 | Exceptional 93.2% |
| Immigrants | Kazakhstan | 92.4 /100 | #127 | Exceptional 93.1% |
| Immigrants | Jordan | 92.4 /100 | #128 | Exceptional 93.1% |
| Immigrants | Ukraine | 89.8 /100 | #129 | Excellent 93.0% |