Yakama vs Immigrants from Belarus Professional Degree
COMPARE
Yakama
Immigrants from Belarus
Professional Degree
Professional Degree Comparison
Yakama
Immigrants from Belarus
3.1%
PROFESSIONAL DEGREE
0.0/ 100
METRIC RATING
332nd/ 347
METRIC RANK
5.5%
PROFESSIONAL DEGREE
99.9/ 100
METRIC RATING
62nd/ 347
METRIC RANK
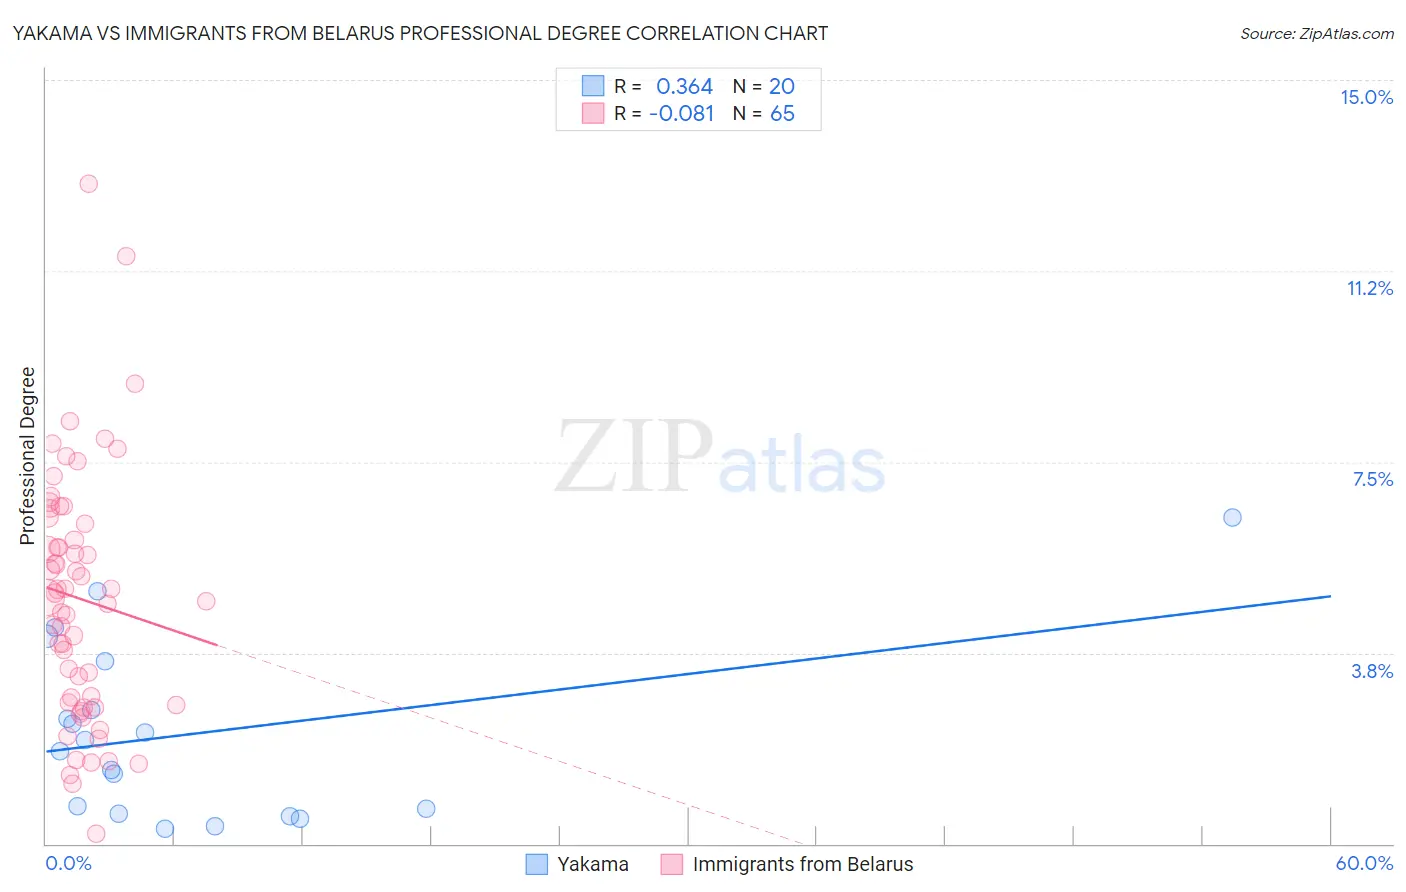
Yakama vs Immigrants from Belarus Professional Degree Correlation Chart
The statistical analysis conducted on geographies consisting of 19,874,339 people shows a mild positive correlation between the proportion of Yakama and percentage of population with at least professional degree education in the United States with a correlation coefficient (R) of 0.364 and weighted average of 3.1%. Similarly, the statistical analysis conducted on geographies consisting of 150,142,268 people shows a slight negative correlation between the proportion of Immigrants from Belarus and percentage of population with at least professional degree education in the United States with a correlation coefficient (R) of -0.081 and weighted average of 5.5%, a difference of 79.6%.
Professional Degree Correlation Summary
| Measurement | Yakama | Immigrants from Belarus |
| Minimum | 0.31% | 0.19% |
| Maximum | 6.4% | 13.0% |
| Range | 6.1% | 12.8% |
| Mean | 2.2% | 4.8% |
| Median | 1.9% | 4.8% |
| Interquartile 25% (IQ1) | 0.64% | 2.8% |
| Interquartile 75% (IQ3) | 3.1% | 6.3% |
| Interquartile Range (IQR) | 2.5% | 3.6% |
| Standard Deviation (Sample) | 1.7% | 2.4% |
| Standard Deviation (Population) | 1.7% | 2.4% |
Similar Demographics by Professional Degree
Demographics Similar to Yakama by Professional Degree
In terms of professional degree, the demographic groups most similar to Yakama are Puget Sound Salish (3.1%, a difference of 0.030%), Kiowa (3.1%, a difference of 0.11%), Immigrants from Cabo Verde (3.1%, a difference of 0.23%), Bangladeshi (3.1%, a difference of 0.31%), and Creek (3.1%, a difference of 0.52%).
| Demographics | Rating | Rank | Professional Degree |
| Yaqui | 0.0 /100 | #325 | Tragic 3.2% |
| Menominee | 0.0 /100 | #326 | Tragic 3.1% |
| Dutch West Indians | 0.0 /100 | #327 | Tragic 3.1% |
| Creek | 0.0 /100 | #328 | Tragic 3.1% |
| Bangladeshis | 0.0 /100 | #329 | Tragic 3.1% |
| Immigrants | Cabo Verde | 0.0 /100 | #330 | Tragic 3.1% |
| Kiowa | 0.0 /100 | #331 | Tragic 3.1% |
| Yakama | 0.0 /100 | #332 | Tragic 3.1% |
| Puget Sound Salish | 0.0 /100 | #333 | Tragic 3.1% |
| Pennsylvania Germans | 0.0 /100 | #334 | Tragic 3.0% |
| Natives/Alaskans | 0.0 /100 | #335 | Tragic 3.0% |
| Fijians | 0.0 /100 | #336 | Tragic 2.9% |
| Arapaho | 0.0 /100 | #337 | Tragic 2.9% |
| Navajo | 0.0 /100 | #338 | Tragic 2.9% |
| Immigrants | Central America | 0.0 /100 | #339 | Tragic 2.9% |
Demographics Similar to Immigrants from Belarus by Professional Degree
In terms of professional degree, the demographic groups most similar to Immigrants from Belarus are Asian (5.5%, a difference of 0.43%), Immigrants from Asia (5.5%, a difference of 0.49%), Immigrants from Bolivia (5.5%, a difference of 0.56%), Immigrants from Lithuania (5.6%, a difference of 0.76%), and Immigrants from Kazakhstan (5.5%, a difference of 0.79%).
| Demographics | Rating | Rank | Professional Degree |
| Immigrants | Western Europe | 100.0 /100 | #55 | Exceptional 5.7% |
| Immigrants | Malaysia | 100.0 /100 | #56 | Exceptional 5.7% |
| South Africans | 100.0 /100 | #57 | Exceptional 5.7% |
| Bulgarians | 100.0 /100 | #58 | Exceptional 5.7% |
| Immigrants | Europe | 100.0 /100 | #59 | Exceptional 5.6% |
| Bolivians | 99.9 /100 | #60 | Exceptional 5.6% |
| Immigrants | Lithuania | 99.9 /100 | #61 | Exceptional 5.6% |
| Immigrants | Belarus | 99.9 /100 | #62 | Exceptional 5.5% |
| Asians | 99.9 /100 | #63 | Exceptional 5.5% |
| Immigrants | Asia | 99.9 /100 | #64 | Exceptional 5.5% |
| Immigrants | Bolivia | 99.9 /100 | #65 | Exceptional 5.5% |
| Immigrants | Kazakhstan | 99.9 /100 | #66 | Exceptional 5.5% |
| Immigrants | Bulgaria | 99.9 /100 | #67 | Exceptional 5.5% |
| Immigrants | Lebanon | 99.9 /100 | #68 | Exceptional 5.5% |
| Immigrants | Hungary | 99.9 /100 | #69 | Exceptional 5.5% |