Yakama vs Immigrants from Cambodia 11th Grade
COMPARE
Yakama
Immigrants from Cambodia
11th Grade
11th Grade Comparison
Yakama
Immigrants from Cambodia
85.0%
11TH GRADE
0.0/ 100
METRIC RATING
344th/ 347
METRIC RANK
89.6%
11TH GRADE
0.0/ 100
METRIC RATING
305th/ 347
METRIC RANK
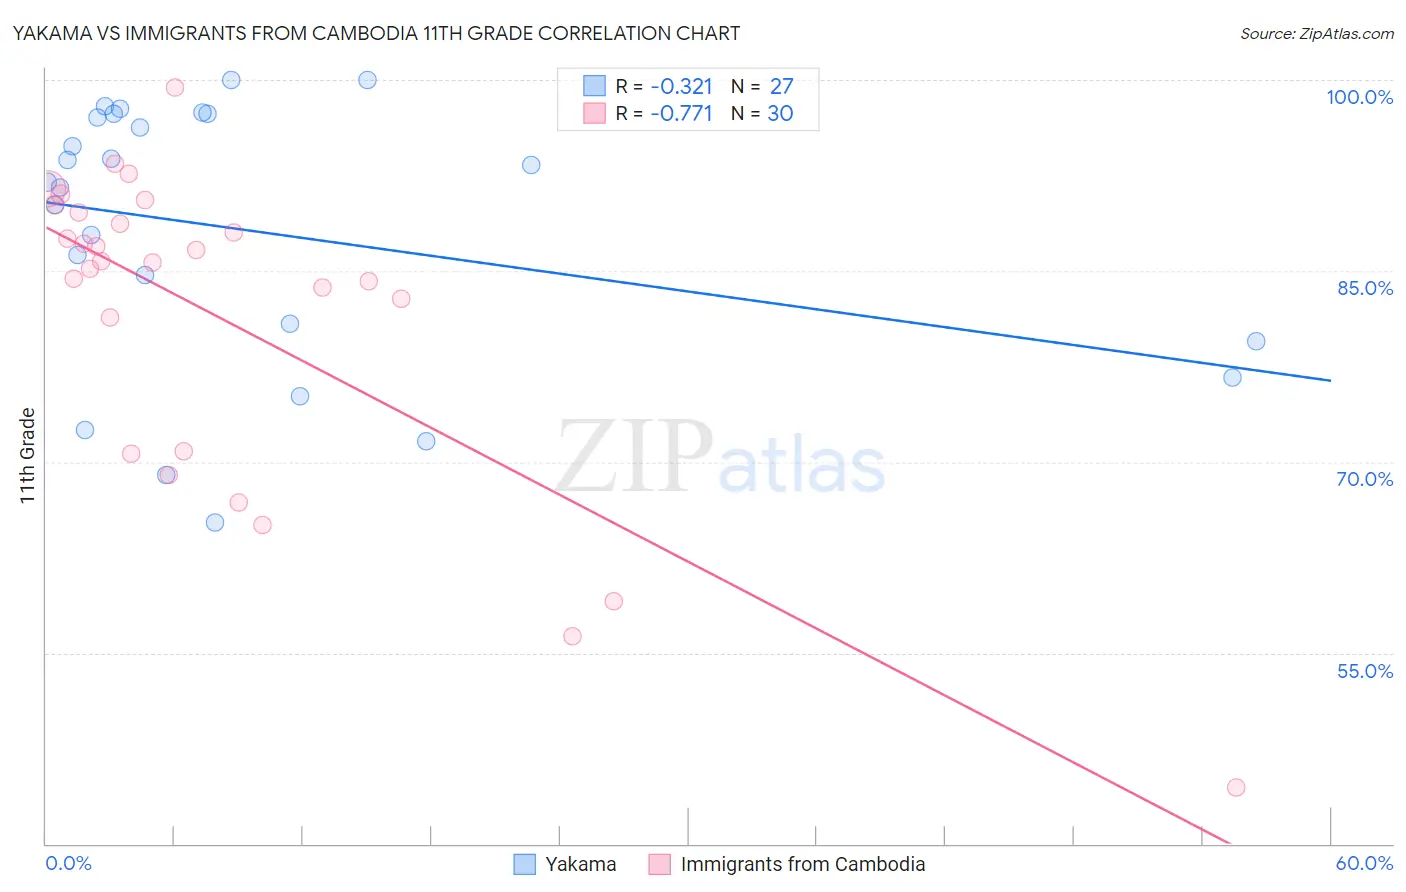
Yakama vs Immigrants from Cambodia 11th Grade Correlation Chart
The statistical analysis conducted on geographies consisting of 19,923,144 people shows a mild negative correlation between the proportion of Yakama and percentage of population with at least 11th grade education in the United States with a correlation coefficient (R) of -0.321 and weighted average of 85.0%. Similarly, the statistical analysis conducted on geographies consisting of 205,153,442 people shows a strong negative correlation between the proportion of Immigrants from Cambodia and percentage of population with at least 11th grade education in the United States with a correlation coefficient (R) of -0.771 and weighted average of 89.6%, a difference of 5.5%.
11th Grade Correlation Summary
| Measurement | Yakama | Immigrants from Cambodia |
| Minimum | 65.2% | 44.4% |
| Maximum | 100.0% | 99.4% |
| Range | 34.8% | 54.9% |
| Mean | 88.1% | 81.3% |
| Median | 92.0% | 85.7% |
| Interquartile 25% (IQ1) | 79.5% | 70.9% |
| Interquartile 75% (IQ3) | 97.3% | 89.6% |
| Interquartile Range (IQR) | 17.9% | 18.7% |
| Standard Deviation (Sample) | 10.5% | 12.7% |
| Standard Deviation (Population) | 10.3% | 12.5% |
Similar Demographics by 11th Grade
Demographics Similar to Yakama by 11th Grade
In terms of 11th grade, the demographic groups most similar to Yakama are Immigrants from Central America (84.9%, a difference of 0.030%), Spanish American Indian (84.7%, a difference of 0.27%), Immigrants from El Salvador (85.3%, a difference of 0.40%), Immigrants from Mexico (84.5%, a difference of 0.57%), and Immigrants from Guatemala (85.8%, a difference of 1.0%).
| Demographics | Rating | Rank | 11th Grade |
| Immigrants | Yemen | 0.0 /100 | #333 | Tragic 87.1% |
| Houma | 0.0 /100 | #334 | Tragic 87.0% |
| Central Americans | 0.0 /100 | #335 | Tragic 86.9% |
| Immigrants | Dominican Republic | 0.0 /100 | #336 | Tragic 86.9% |
| Immigrants | Honduras | 0.0 /100 | #337 | Tragic 86.9% |
| Immigrants | Latin America | 0.0 /100 | #338 | Tragic 86.8% |
| Guatemalans | 0.0 /100 | #339 | Tragic 86.4% |
| Salvadorans | 0.0 /100 | #340 | Tragic 86.2% |
| Mexicans | 0.0 /100 | #341 | Tragic 86.1% |
| Immigrants | Guatemala | 0.0 /100 | #342 | Tragic 85.8% |
| Immigrants | El Salvador | 0.0 /100 | #343 | Tragic 85.3% |
| Yakama | 0.0 /100 | #344 | Tragic 85.0% |
| Immigrants | Central America | 0.0 /100 | #345 | Tragic 84.9% |
| Spanish American Indians | 0.0 /100 | #346 | Tragic 84.7% |
| Immigrants | Mexico | 0.0 /100 | #347 | Tragic 84.5% |
Demographics Similar to Immigrants from Cambodia by 11th Grade
In terms of 11th grade, the demographic groups most similar to Immigrants from Cambodia are Ecuadorian (89.6%, a difference of 0.050%), Immigrants (89.7%, a difference of 0.080%), Yuman (89.7%, a difference of 0.080%), Immigrants from Guyana (89.7%, a difference of 0.090%), and Immigrants from Dominica (89.5%, a difference of 0.10%).
| Demographics | Rating | Rank | 11th Grade |
| Immigrants | Fiji | 0.0 /100 | #298 | Tragic 89.9% |
| Japanese | 0.0 /100 | #299 | Tragic 89.9% |
| Immigrants | Haiti | 0.0 /100 | #300 | Tragic 89.9% |
| Guyanese | 0.0 /100 | #301 | Tragic 89.9% |
| Immigrants | Guyana | 0.0 /100 | #302 | Tragic 89.7% |
| Immigrants | Immigrants | 0.0 /100 | #303 | Tragic 89.7% |
| Yuman | 0.0 /100 | #304 | Tragic 89.7% |
| Immigrants | Cambodia | 0.0 /100 | #305 | Tragic 89.6% |
| Ecuadorians | 0.0 /100 | #306 | Tragic 89.6% |
| Immigrants | Dominica | 0.0 /100 | #307 | Tragic 89.5% |
| Nepalese | 0.0 /100 | #308 | Tragic 89.5% |
| Immigrants | Bangladesh | 0.0 /100 | #309 | Tragic 89.5% |
| Yaqui | 0.0 /100 | #310 | Tragic 89.5% |
| Vietnamese | 0.0 /100 | #311 | Tragic 89.4% |
| Immigrants | Portugal | 0.0 /100 | #312 | Tragic 89.3% |