Kiowa vs Immigrants from Belarus 11th Grade
COMPARE
Kiowa
Immigrants from Belarus
11th Grade
11th Grade Comparison
Kiowa
Immigrants from Belarus
92.2%
11TH GRADE
23.2/ 100
METRIC RATING
205th/ 347
METRIC RANK
93.3%
11TH GRADE
96.3/ 100
METRIC RATING
122nd/ 347
METRIC RANK
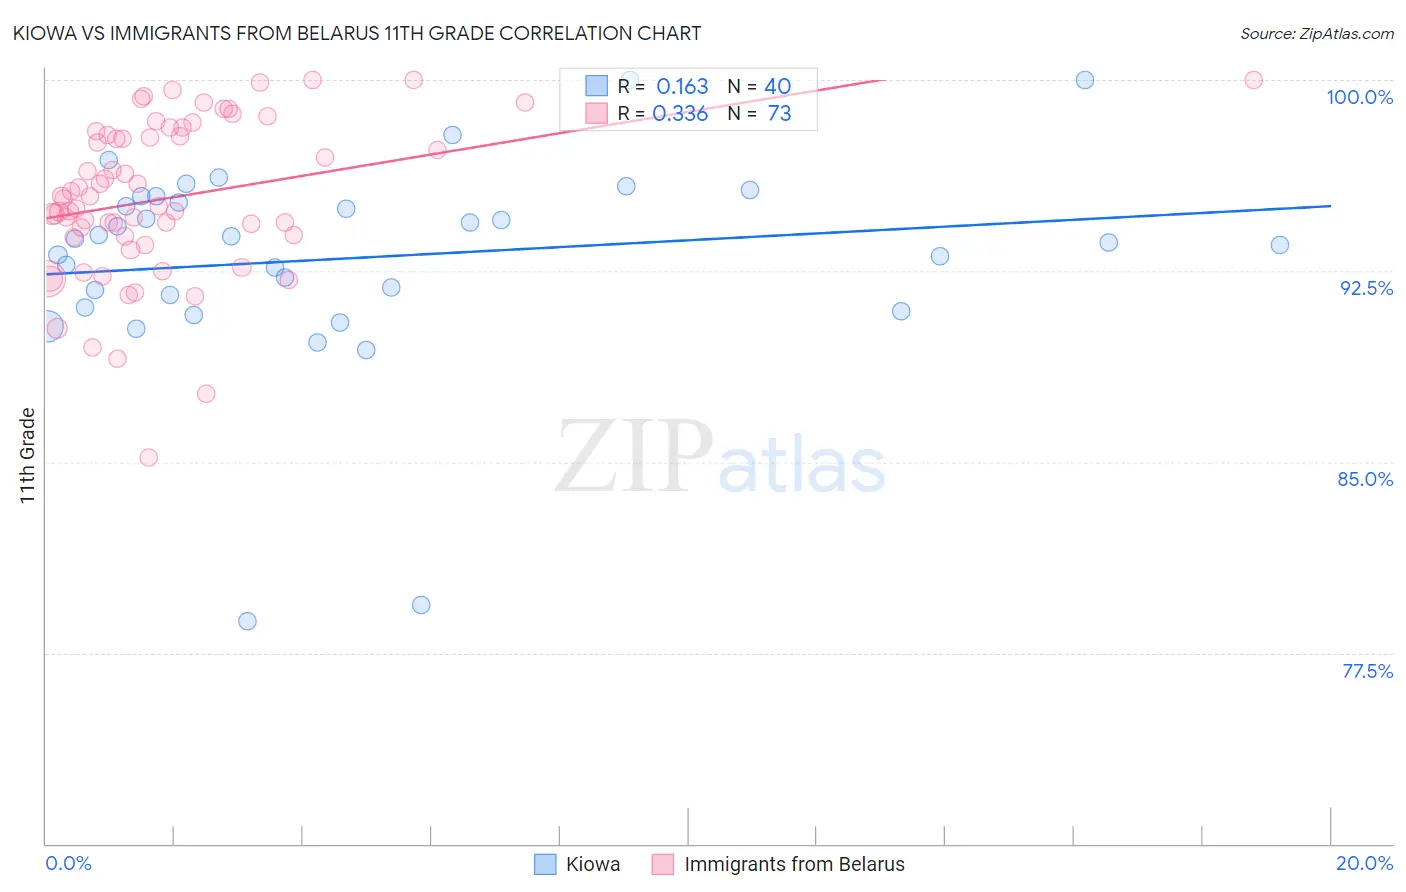
Kiowa vs Immigrants from Belarus 11th Grade Correlation Chart
The statistical analysis conducted on geographies consisting of 56,101,759 people shows a poor positive correlation between the proportion of Kiowa and percentage of population with at least 11th grade education in the United States with a correlation coefficient (R) of 0.163 and weighted average of 92.2%. Similarly, the statistical analysis conducted on geographies consisting of 150,125,045 people shows a mild positive correlation between the proportion of Immigrants from Belarus and percentage of population with at least 11th grade education in the United States with a correlation coefficient (R) of 0.336 and weighted average of 93.3%, a difference of 1.1%.
11th Grade Correlation Summary
| Measurement | Kiowa | Immigrants from Belarus |
| Minimum | 78.7% | 85.2% |
| Maximum | 100.0% | 100.0% |
| Range | 21.3% | 14.8% |
| Mean | 93.0% | 95.4% |
| Median | 93.7% | 95.3% |
| Interquartile 25% (IQ1) | 91.3% | 93.8% |
| Interquartile 75% (IQ3) | 95.3% | 97.9% |
| Interquartile Range (IQR) | 4.0% | 4.1% |
| Standard Deviation (Sample) | 4.1% | 3.1% |
| Standard Deviation (Population) | 4.1% | 3.1% |
Similar Demographics by 11th Grade
Demographics Similar to Kiowa by 11th Grade
In terms of 11th grade, the demographic groups most similar to Kiowa are Immigrants from Sudan (92.3%, a difference of 0.0%), Immigrants from Hong Kong (92.2%, a difference of 0.0%), Bolivian (92.2%, a difference of 0.0%), Immigrants from Eastern Africa (92.3%, a difference of 0.010%), and Immigrants from Oceania (92.2%, a difference of 0.010%).
| Demographics | Rating | Rank | 11th Grade |
| Hawaiians | 25.5 /100 | #198 | Fair 92.3% |
| Immigrants | Uganda | 25.2 /100 | #199 | Fair 92.3% |
| Samoans | 25.1 /100 | #200 | Fair 92.3% |
| Immigrants | China | 25.1 /100 | #201 | Fair 92.3% |
| Immigrants | Eastern Africa | 24.1 /100 | #202 | Fair 92.3% |
| Immigrants | Sudan | 23.5 /100 | #203 | Fair 92.3% |
| Immigrants | Hong Kong | 23.3 /100 | #204 | Fair 92.2% |
| Kiowa | 23.2 /100 | #205 | Fair 92.2% |
| Bolivians | 23.2 /100 | #206 | Fair 92.2% |
| Immigrants | Oceania | 22.4 /100 | #207 | Fair 92.2% |
| Colville | 21.8 /100 | #208 | Fair 92.2% |
| Tongans | 19.8 /100 | #209 | Poor 92.2% |
| Ethiopians | 18.8 /100 | #210 | Poor 92.2% |
| Immigrants | Micronesia | 17.7 /100 | #211 | Poor 92.2% |
| Koreans | 14.4 /100 | #212 | Poor 92.1% |
Demographics Similar to Immigrants from Belarus by 11th Grade
In terms of 11th grade, the demographic groups most similar to Immigrants from Belarus are German Russian (93.3%, a difference of 0.0%), Immigrants from Russia (93.3%, a difference of 0.020%), Immigrants from Greece (93.2%, a difference of 0.030%), Immigrants from Eastern Europe (93.2%, a difference of 0.030%), and Immigrants from Sri Lanka (93.2%, a difference of 0.040%).
| Demographics | Rating | Rank | 11th Grade |
| Palestinians | 97.7 /100 | #115 | Exceptional 93.4% |
| Immigrants | Hungary | 97.5 /100 | #116 | Exceptional 93.4% |
| Whites/Caucasians | 97.4 /100 | #117 | Exceptional 93.3% |
| Immigrants | Korea | 97.0 /100 | #118 | Exceptional 93.3% |
| Israelis | 97.0 /100 | #119 | Exceptional 93.3% |
| Immigrants | Russia | 96.6 /100 | #120 | Exceptional 93.3% |
| German Russians | 96.4 /100 | #121 | Exceptional 93.3% |
| Immigrants | Belarus | 96.3 /100 | #122 | Exceptional 93.3% |
| Immigrants | Greece | 95.9 /100 | #123 | Exceptional 93.2% |
| Immigrants | Eastern Europe | 95.9 /100 | #124 | Exceptional 93.2% |
| Immigrants | Sri Lanka | 95.6 /100 | #125 | Exceptional 93.2% |
| Basques | 95.2 /100 | #126 | Exceptional 93.2% |
| Immigrants | Kazakhstan | 92.4 /100 | #127 | Exceptional 93.1% |
| Immigrants | Jordan | 92.4 /100 | #128 | Exceptional 93.1% |
| Immigrants | Ukraine | 89.8 /100 | #129 | Excellent 93.0% |