Delaware vs Immigrants from Belarus 11th Grade
COMPARE
Delaware
Immigrants from Belarus
11th Grade
11th Grade Comparison
Delaware
Immigrants from Belarus
93.0%
11TH GRADE
87.3/ 100
METRIC RATING
134th/ 347
METRIC RANK
93.3%
11TH GRADE
96.3/ 100
METRIC RATING
122nd/ 347
METRIC RANK
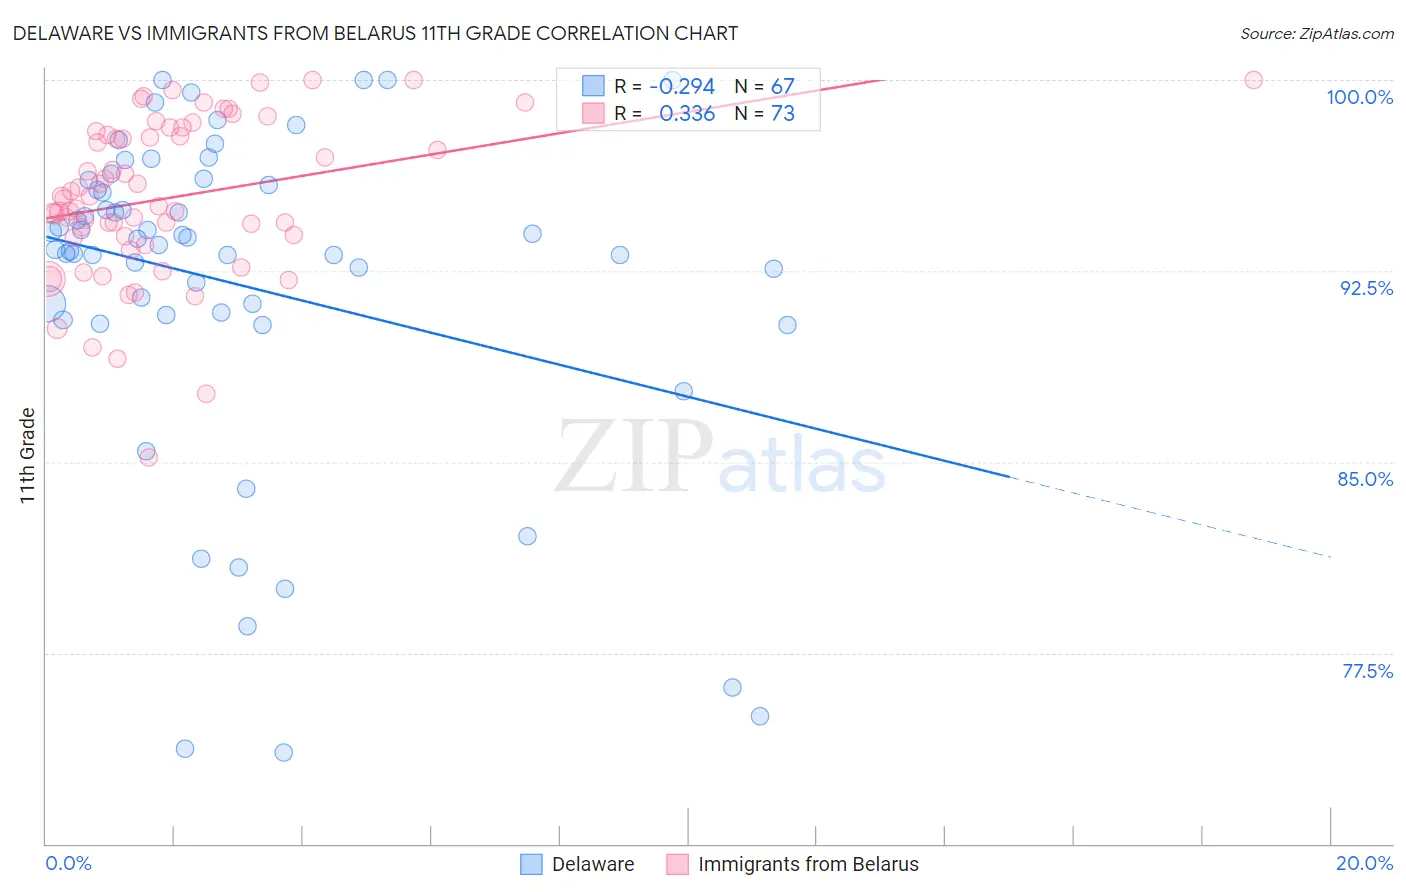
Delaware vs Immigrants from Belarus 11th Grade Correlation Chart
The statistical analysis conducted on geographies consisting of 96,234,866 people shows a weak negative correlation between the proportion of Delaware and percentage of population with at least 11th grade education in the United States with a correlation coefficient (R) of -0.294 and weighted average of 93.0%. Similarly, the statistical analysis conducted on geographies consisting of 150,125,045 people shows a mild positive correlation between the proportion of Immigrants from Belarus and percentage of population with at least 11th grade education in the United States with a correlation coefficient (R) of 0.336 and weighted average of 93.3%, a difference of 0.33%.
11th Grade Correlation Summary
| Measurement | Delaware | Immigrants from Belarus |
| Minimum | 73.6% | 85.2% |
| Maximum | 100.0% | 100.0% |
| Range | 26.4% | 14.8% |
| Mean | 92.0% | 95.4% |
| Median | 93.5% | 95.3% |
| Interquartile 25% (IQ1) | 90.8% | 93.8% |
| Interquartile 75% (IQ3) | 95.9% | 97.9% |
| Interquartile Range (IQR) | 5.1% | 4.1% |
| Standard Deviation (Sample) | 6.5% | 3.1% |
| Standard Deviation (Population) | 6.4% | 3.1% |
Demographics Similar to Delaware and Immigrants from Belarus by 11th Grade
In terms of 11th grade, the demographic groups most similar to Delaware are Mongolian (93.0%, a difference of 0.010%), Immigrants from Italy (92.9%, a difference of 0.020%), Cree (92.9%, a difference of 0.030%), Immigrants from Bosnia and Herzegovina (93.0%, a difference of 0.040%), and Arab (92.9%, a difference of 0.040%). Similarly, the demographic groups most similar to Immigrants from Belarus are German Russian (93.3%, a difference of 0.0%), Immigrants from Russia (93.3%, a difference of 0.020%), Immigrants from Greece (93.2%, a difference of 0.030%), Immigrants from Eastern Europe (93.2%, a difference of 0.030%), and Immigrants from Sri Lanka (93.2%, a difference of 0.040%).
| Demographics | Rating | Rank | 11th Grade |
| Immigrants | Korea | 97.0 /100 | #118 | Exceptional 93.3% |
| Israelis | 97.0 /100 | #119 | Exceptional 93.3% |
| Immigrants | Russia | 96.6 /100 | #120 | Exceptional 93.3% |
| German Russians | 96.4 /100 | #121 | Exceptional 93.3% |
| Immigrants | Belarus | 96.3 /100 | #122 | Exceptional 93.3% |
| Immigrants | Greece | 95.9 /100 | #123 | Exceptional 93.2% |
| Immigrants | Eastern Europe | 95.9 /100 | #124 | Exceptional 93.2% |
| Immigrants | Sri Lanka | 95.6 /100 | #125 | Exceptional 93.2% |
| Basques | 95.2 /100 | #126 | Exceptional 93.2% |
| Immigrants | Kazakhstan | 92.4 /100 | #127 | Exceptional 93.1% |
| Immigrants | Jordan | 92.4 /100 | #128 | Exceptional 93.1% |
| Immigrants | Ukraine | 89.8 /100 | #129 | Excellent 93.0% |
| Albanians | 89.5 /100 | #130 | Excellent 93.0% |
| Egyptians | 89.5 /100 | #131 | Excellent 93.0% |
| Immigrants | Bosnia and Herzegovina | 89.0 /100 | #132 | Excellent 93.0% |
| Mongolians | 87.6 /100 | #133 | Excellent 93.0% |
| Delaware | 87.3 /100 | #134 | Excellent 93.0% |
| Immigrants | Italy | 86.6 /100 | #135 | Excellent 92.9% |
| Cree | 85.9 /100 | #136 | Excellent 92.9% |
| Arabs | 85.4 /100 | #137 | Excellent 92.9% |
| Immigrants | Brazil | 85.1 /100 | #138 | Excellent 92.9% |