Yakama vs Immigrants from Argentina 11th Grade
COMPARE
Yakama
Immigrants from Argentina
11th Grade
11th Grade Comparison
Yakama
Immigrants from Argentina
85.0%
11TH GRADE
0.0/ 100
METRIC RATING
344th/ 347
METRIC RANK
92.7%
11TH GRADE
69.8/ 100
METRIC RATING
161st/ 347
METRIC RANK
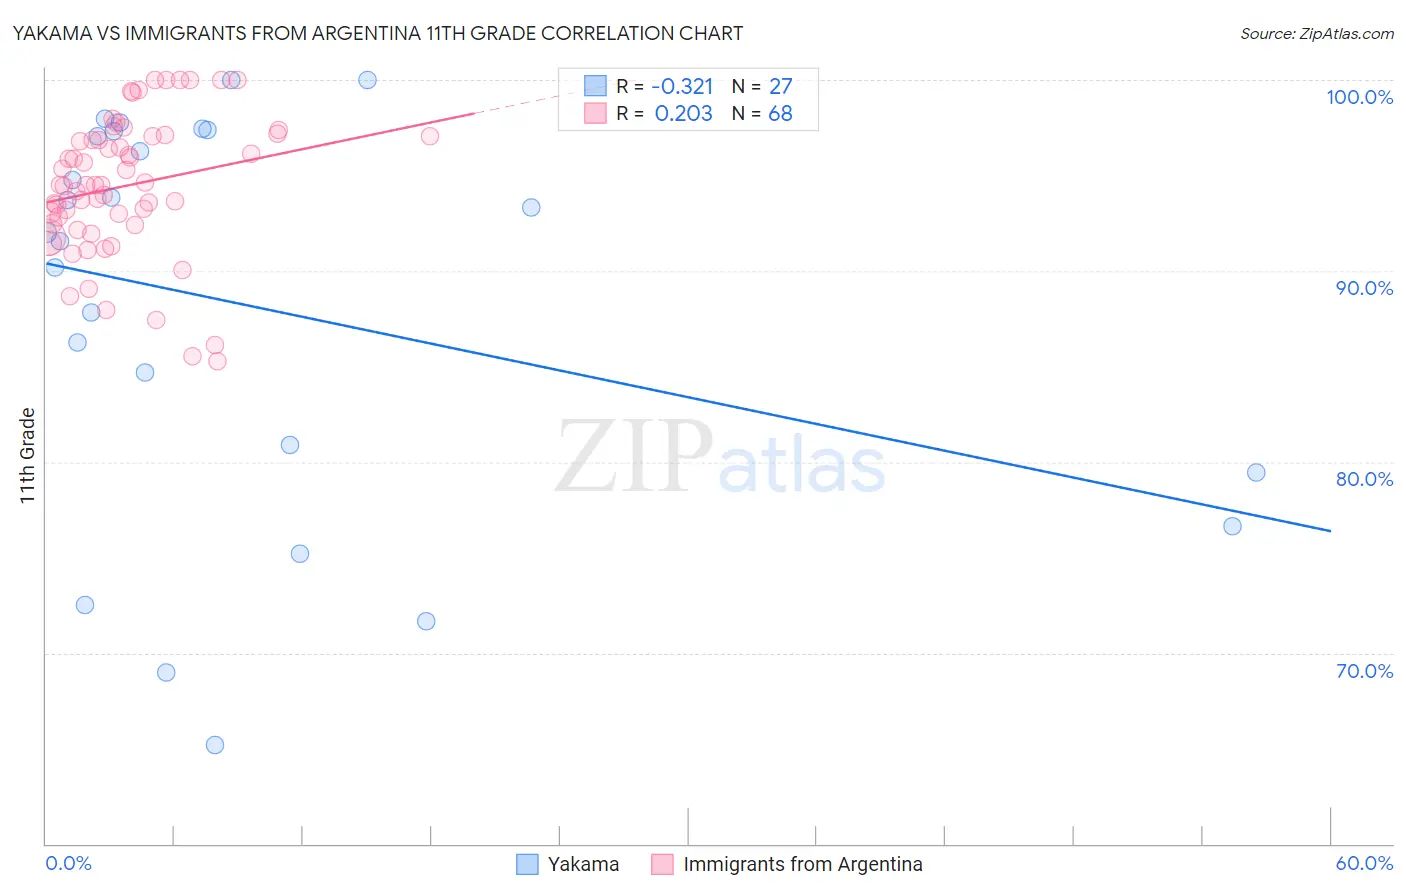
Yakama vs Immigrants from Argentina 11th Grade Correlation Chart
The statistical analysis conducted on geographies consisting of 19,923,144 people shows a mild negative correlation between the proportion of Yakama and percentage of population with at least 11th grade education in the United States with a correlation coefficient (R) of -0.321 and weighted average of 85.0%. Similarly, the statistical analysis conducted on geographies consisting of 264,436,618 people shows a weak positive correlation between the proportion of Immigrants from Argentina and percentage of population with at least 11th grade education in the United States with a correlation coefficient (R) of 0.203 and weighted average of 92.7%, a difference of 9.1%.
11th Grade Correlation Summary
| Measurement | Yakama | Immigrants from Argentina |
| Minimum | 65.2% | 85.2% |
| Maximum | 100.0% | 100.0% |
| Range | 34.8% | 14.8% |
| Mean | 88.1% | 94.5% |
| Median | 92.0% | 94.5% |
| Interquartile 25% (IQ1) | 79.5% | 92.4% |
| Interquartile 75% (IQ3) | 97.3% | 97.1% |
| Interquartile Range (IQR) | 17.9% | 4.6% |
| Standard Deviation (Sample) | 10.5% | 3.6% |
| Standard Deviation (Population) | 10.3% | 3.6% |
Similar Demographics by 11th Grade
Demographics Similar to Yakama by 11th Grade
In terms of 11th grade, the demographic groups most similar to Yakama are Immigrants from Central America (84.9%, a difference of 0.030%), Spanish American Indian (84.7%, a difference of 0.27%), Immigrants from El Salvador (85.3%, a difference of 0.40%), Immigrants from Mexico (84.5%, a difference of 0.57%), and Immigrants from Guatemala (85.8%, a difference of 1.0%).
| Demographics | Rating | Rank | 11th Grade |
| Immigrants | Yemen | 0.0 /100 | #333 | Tragic 87.1% |
| Houma | 0.0 /100 | #334 | Tragic 87.0% |
| Central Americans | 0.0 /100 | #335 | Tragic 86.9% |
| Immigrants | Dominican Republic | 0.0 /100 | #336 | Tragic 86.9% |
| Immigrants | Honduras | 0.0 /100 | #337 | Tragic 86.9% |
| Immigrants | Latin America | 0.0 /100 | #338 | Tragic 86.8% |
| Guatemalans | 0.0 /100 | #339 | Tragic 86.4% |
| Salvadorans | 0.0 /100 | #340 | Tragic 86.2% |
| Mexicans | 0.0 /100 | #341 | Tragic 86.1% |
| Immigrants | Guatemala | 0.0 /100 | #342 | Tragic 85.8% |
| Immigrants | El Salvador | 0.0 /100 | #343 | Tragic 85.3% |
| Yakama | 0.0 /100 | #344 | Tragic 85.0% |
| Immigrants | Central America | 0.0 /100 | #345 | Tragic 84.9% |
| Spanish American Indians | 0.0 /100 | #346 | Tragic 84.7% |
| Immigrants | Mexico | 0.0 /100 | #347 | Tragic 84.5% |
Demographics Similar to Immigrants from Argentina by 11th Grade
In terms of 11th grade, the demographic groups most similar to Immigrants from Argentina are Immigrants from Lebanon (92.7%, a difference of 0.010%), Paraguayan (92.7%, a difference of 0.010%), American (92.7%, a difference of 0.020%), Immigrants from Eastern Asia (92.7%, a difference of 0.030%), and Immigrants from Venezuela (92.7%, a difference of 0.030%).
| Demographics | Rating | Rank | 11th Grade |
| Osage | 73.4 /100 | #154 | Good 92.7% |
| Argentineans | 73.4 /100 | #155 | Good 92.7% |
| Immigrants | Spain | 73.0 /100 | #156 | Good 92.7% |
| Immigrants | Eastern Asia | 72.6 /100 | #157 | Good 92.7% |
| Immigrants | Venezuela | 72.0 /100 | #158 | Good 92.7% |
| Americans | 71.7 /100 | #159 | Good 92.7% |
| Immigrants | Lebanon | 70.7 /100 | #160 | Good 92.7% |
| Immigrants | Argentina | 69.8 /100 | #161 | Good 92.7% |
| Paraguayans | 68.7 /100 | #162 | Good 92.7% |
| Immigrants | Nonimmigrants | 66.6 /100 | #163 | Good 92.7% |
| Spanish | 66.2 /100 | #164 | Good 92.7% |
| Immigrants | Iraq | 63.7 /100 | #165 | Good 92.6% |
| Bermudans | 62.3 /100 | #166 | Good 92.6% |
| Alsatians | 60.2 /100 | #167 | Good 92.6% |
| Sierra Leoneans | 58.7 /100 | #168 | Average 92.6% |