U.S. Virgin Islander vs Ecuadorian 9th Grade
COMPARE
U.S. Virgin Islander
Ecuadorian
9th Grade
9th Grade Comparison
U.S. Virgin Islanders
Ecuadorians
94.0%
9TH GRADE
0.7/ 100
METRIC RATING
254th/ 347
METRIC RANK
91.9%
9TH GRADE
0.0/ 100
METRIC RATING
319th/ 347
METRIC RANK
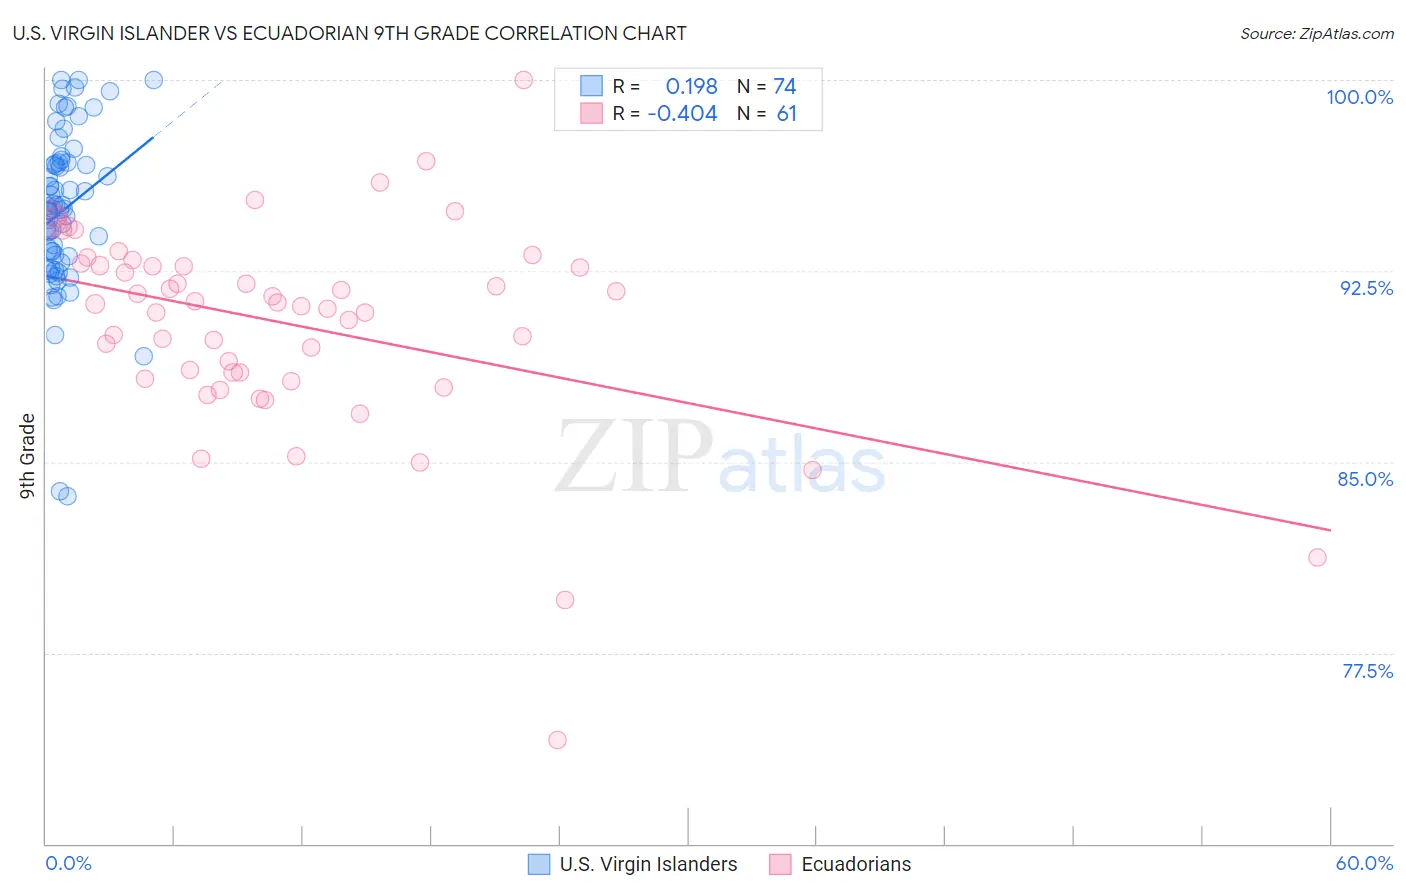
U.S. Virgin Islander vs Ecuadorian 9th Grade Correlation Chart
The statistical analysis conducted on geographies consisting of 87,529,315 people shows a poor positive correlation between the proportion of U.S. Virgin Islanders and percentage of population with at least 9th grade education in the United States with a correlation coefficient (R) of 0.198 and weighted average of 94.0%. Similarly, the statistical analysis conducted on geographies consisting of 317,864,750 people shows a moderate negative correlation between the proportion of Ecuadorians and percentage of population with at least 9th grade education in the United States with a correlation coefficient (R) of -0.404 and weighted average of 91.9%, a difference of 2.3%.
9th Grade Correlation Summary
| Measurement | U.S. Virgin Islander | Ecuadorian |
| Minimum | 83.6% | 74.1% |
| Maximum | 100.0% | 100.0% |
| Range | 16.4% | 25.9% |
| Mean | 94.9% | 90.4% |
| Median | 94.9% | 91.2% |
| Interquartile 25% (IQ1) | 93.1% | 88.4% |
| Interquartile 75% (IQ3) | 96.7% | 92.8% |
| Interquartile Range (IQR) | 3.7% | 4.4% |
| Standard Deviation (Sample) | 3.2% | 4.1% |
| Standard Deviation (Population) | 3.2% | 4.1% |
Similar Demographics by 9th Grade
Demographics Similar to U.S. Virgin Islanders by 9th Grade
In terms of 9th grade, the demographic groups most similar to U.S. Virgin Islanders are Colombian (94.0%, a difference of 0.030%), Immigrants from Senegal (94.1%, a difference of 0.050%), Immigrants from Nigeria (94.0%, a difference of 0.050%), Jamaican (94.1%, a difference of 0.060%), and Immigrants from Afghanistan (94.0%, a difference of 0.060%).
| Demographics | Rating | Rank | 9th Grade |
| Afghans | 1.8 /100 | #247 | Tragic 94.2% |
| Immigrants | Somalia | 1.4 /100 | #248 | Tragic 94.1% |
| Uruguayans | 1.3 /100 | #249 | Tragic 94.1% |
| Immigrants | Hong Kong | 1.3 /100 | #250 | Tragic 94.1% |
| Jamaicans | 1.0 /100 | #251 | Tragic 94.1% |
| Immigrants | Senegal | 0.9 /100 | #252 | Tragic 94.1% |
| Colombians | 0.8 /100 | #253 | Tragic 94.0% |
| U.S. Virgin Islanders | 0.7 /100 | #254 | Tragic 94.0% |
| Immigrants | Nigeria | 0.6 /100 | #255 | Tragic 94.0% |
| Immigrants | Afghanistan | 0.5 /100 | #256 | Tragic 94.0% |
| Immigrants | Costa Rica | 0.5 /100 | #257 | Tragic 94.0% |
| Immigrants | Thailand | 0.5 /100 | #258 | Tragic 93.9% |
| Ghanaians | 0.5 /100 | #259 | Tragic 93.9% |
| Pima | 0.4 /100 | #260 | Tragic 93.9% |
| South Americans | 0.4 /100 | #261 | Tragic 93.9% |
Demographics Similar to Ecuadorians by 9th Grade
In terms of 9th grade, the demographic groups most similar to Ecuadorians are Nicaraguan (91.9%, a difference of 0.040%), Nepalese (92.0%, a difference of 0.050%), Immigrants from Ecuador (91.8%, a difference of 0.11%), Belizean (91.8%, a difference of 0.13%), and Puerto Rican (91.8%, a difference of 0.14%).
| Demographics | Rating | Rank | 9th Grade |
| Houma | 0.0 /100 | #312 | Tragic 92.3% |
| Vietnamese | 0.0 /100 | #313 | Tragic 92.3% |
| Immigrants | Portugal | 0.0 /100 | #314 | Tragic 92.2% |
| Immigrants | Caribbean | 0.0 /100 | #315 | Tragic 92.2% |
| Cape Verdeans | 0.0 /100 | #316 | Tragic 92.2% |
| Immigrants | Cuba | 0.0 /100 | #317 | Tragic 92.2% |
| Nepalese | 0.0 /100 | #318 | Tragic 92.0% |
| Ecuadorians | 0.0 /100 | #319 | Tragic 91.9% |
| Nicaraguans | 0.0 /100 | #320 | Tragic 91.9% |
| Immigrants | Ecuador | 0.0 /100 | #321 | Tragic 91.8% |
| Belizeans | 0.0 /100 | #322 | Tragic 91.8% |
| Puerto Ricans | 0.0 /100 | #323 | Tragic 91.8% |
| Immigrants | Belize | 0.0 /100 | #324 | Tragic 91.8% |
| Central American Indians | 0.0 /100 | #325 | Tragic 91.5% |
| Immigrants | Armenia | 0.0 /100 | #326 | Tragic 91.4% |