Yakama vs Ecuadorian Unemployment Among Ages 55 to 59 years
COMPARE
Yakama
Ecuadorian
Unemployment Among Ages 55 to 59 years
Unemployment Among Ages 55 to 59 years Comparison
Yakama
Ecuadorians
8.9%
UNEMPLOYMENT AMONG AGES 55 TO 59 YEARS
0.0/ 100
METRIC RATING
343rd/ 347
METRIC RANK
5.6%
UNEMPLOYMENT AMONG AGES 55 TO 59 YEARS
0.0/ 100
METRIC RATING
312th/ 347
METRIC RANK
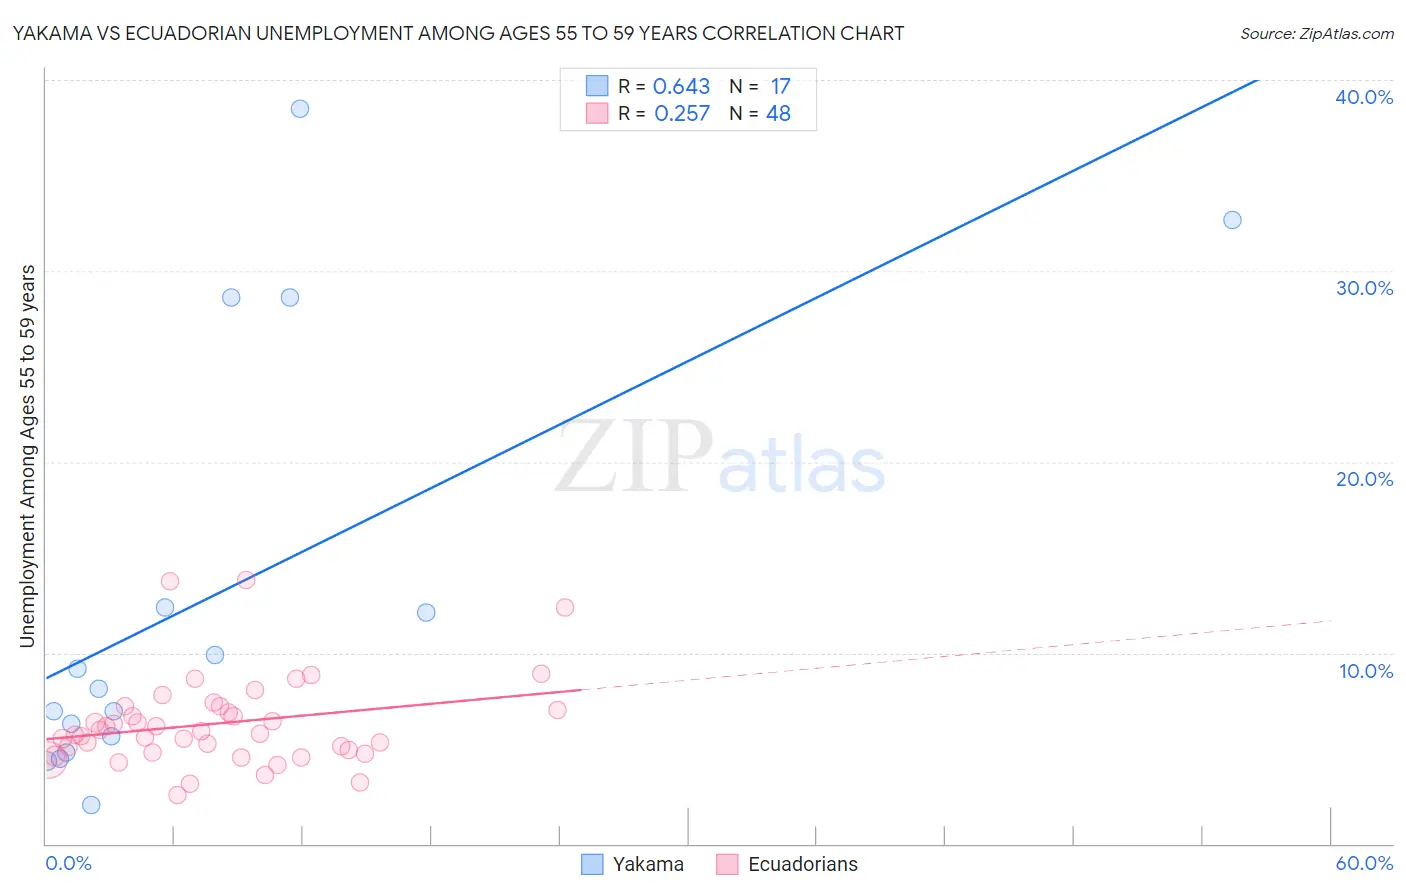
Yakama vs Ecuadorian Unemployment Among Ages 55 to 59 years Correlation Chart
The statistical analysis conducted on geographies consisting of 19,170,351 people shows a significant positive correlation between the proportion of Yakama and unemployment rate among population between the ages 55 and 59 in the United States with a correlation coefficient (R) of 0.643 and weighted average of 8.9%. Similarly, the statistical analysis conducted on geographies consisting of 302,298,527 people shows a weak positive correlation between the proportion of Ecuadorians and unemployment rate among population between the ages 55 and 59 in the United States with a correlation coefficient (R) of 0.257 and weighted average of 5.6%, a difference of 58.5%.
Unemployment Among Ages 55 to 59 years Correlation Summary
| Measurement | Yakama | Ecuadorian |
| Minimum | 2.0% | 2.5% |
| Maximum | 38.5% | 13.8% |
| Range | 36.5% | 11.3% |
| Mean | 13.0% | 6.3% |
| Median | 8.1% | 5.8% |
| Interquartile 25% (IQ1) | 5.2% | 4.8% |
| Interquartile 75% (IQ3) | 20.5% | 7.1% |
| Interquartile Range (IQR) | 15.3% | 2.3% |
| Standard Deviation (Sample) | 11.4% | 2.4% |
| Standard Deviation (Population) | 11.1% | 2.3% |
Similar Demographics by Unemployment Among Ages 55 to 59 years
Demographics Similar to Yakama by Unemployment Among Ages 55 to 59 years
In terms of unemployment among ages 55 to 59 years, the demographic groups most similar to Yakama are Inupiat (9.0%, a difference of 1.2%), Tohono O'odham (9.3%, a difference of 4.3%), Hopi (8.1%, a difference of 10.0%), Menominee (10.5%, a difference of 18.0%), and Shoshone (7.4%, a difference of 21.1%).
| Demographics | Rating | Rank | Unemployment Among Ages 55 to 59 years |
| Pima | 0.0 /100 | #333 | Tragic 6.6% |
| Pueblo | 0.0 /100 | #334 | Tragic 6.7% |
| Colville | 0.0 /100 | #335 | Tragic 6.7% |
| Navajo | 0.0 /100 | #336 | Tragic 6.7% |
| Paiute | 0.0 /100 | #337 | Tragic 6.8% |
| Immigrants | Yemen | 0.0 /100 | #338 | Tragic 6.9% |
| Puerto Ricans | 0.0 /100 | #339 | Tragic 7.0% |
| Alaskan Athabascans | 0.0 /100 | #340 | Tragic 7.1% |
| Shoshone | 0.0 /100 | #341 | Tragic 7.4% |
| Hopi | 0.0 /100 | #342 | Tragic 8.1% |
| Yakama | 0.0 /100 | #343 | Tragic 8.9% |
| Inupiat | 0.0 /100 | #344 | Tragic 9.0% |
| Tohono O'odham | 0.0 /100 | #345 | Tragic 9.3% |
| Menominee | 0.0 /100 | #346 | Tragic 10.5% |
| Yup'ik | 0.0 /100 | #347 | Tragic 13.9% |
Demographics Similar to Ecuadorians by Unemployment Among Ages 55 to 59 years
In terms of unemployment among ages 55 to 59 years, the demographic groups most similar to Ecuadorians are Central American Indian (5.6%, a difference of 0.19%), Houma (5.6%, a difference of 0.21%), Belizean (5.6%, a difference of 0.39%), Tlingit-Haida (5.7%, a difference of 0.48%), and Guyanese (5.7%, a difference of 0.63%).
| Demographics | Rating | Rank | Unemployment Among Ages 55 to 59 years |
| Immigrants | Portugal | 0.0 /100 | #305 | Tragic 5.5% |
| Immigrants | Cabo Verde | 0.0 /100 | #306 | Tragic 5.5% |
| Immigrants | Belize | 0.0 /100 | #307 | Tragic 5.5% |
| Spanish American Indians | 0.0 /100 | #308 | Tragic 5.6% |
| Nepalese | 0.0 /100 | #309 | Tragic 5.6% |
| Belizeans | 0.0 /100 | #310 | Tragic 5.6% |
| Houma | 0.0 /100 | #311 | Tragic 5.6% |
| Ecuadorians | 0.0 /100 | #312 | Tragic 5.6% |
| Central American Indians | 0.0 /100 | #313 | Tragic 5.6% |
| Tlingit-Haida | 0.0 /100 | #314 | Tragic 5.7% |
| Guyanese | 0.0 /100 | #315 | Tragic 5.7% |
| Immigrants | Ecuador | 0.0 /100 | #316 | Tragic 5.7% |
| Hmong | 0.0 /100 | #317 | Tragic 5.7% |
| Immigrants | Guyana | 0.0 /100 | #318 | Tragic 5.8% |
| Kiowa | 0.0 /100 | #319 | Tragic 5.8% |