Filipino vs Ecuadorian 9th Grade
COMPARE
Filipino
Ecuadorian
9th Grade
9th Grade Comparison
Filipinos
Ecuadorians
95.6%
9TH GRADE
98.5/ 100
METRIC RATING
96th/ 347
METRIC RANK
91.9%
9TH GRADE
0.0/ 100
METRIC RATING
319th/ 347
METRIC RANK
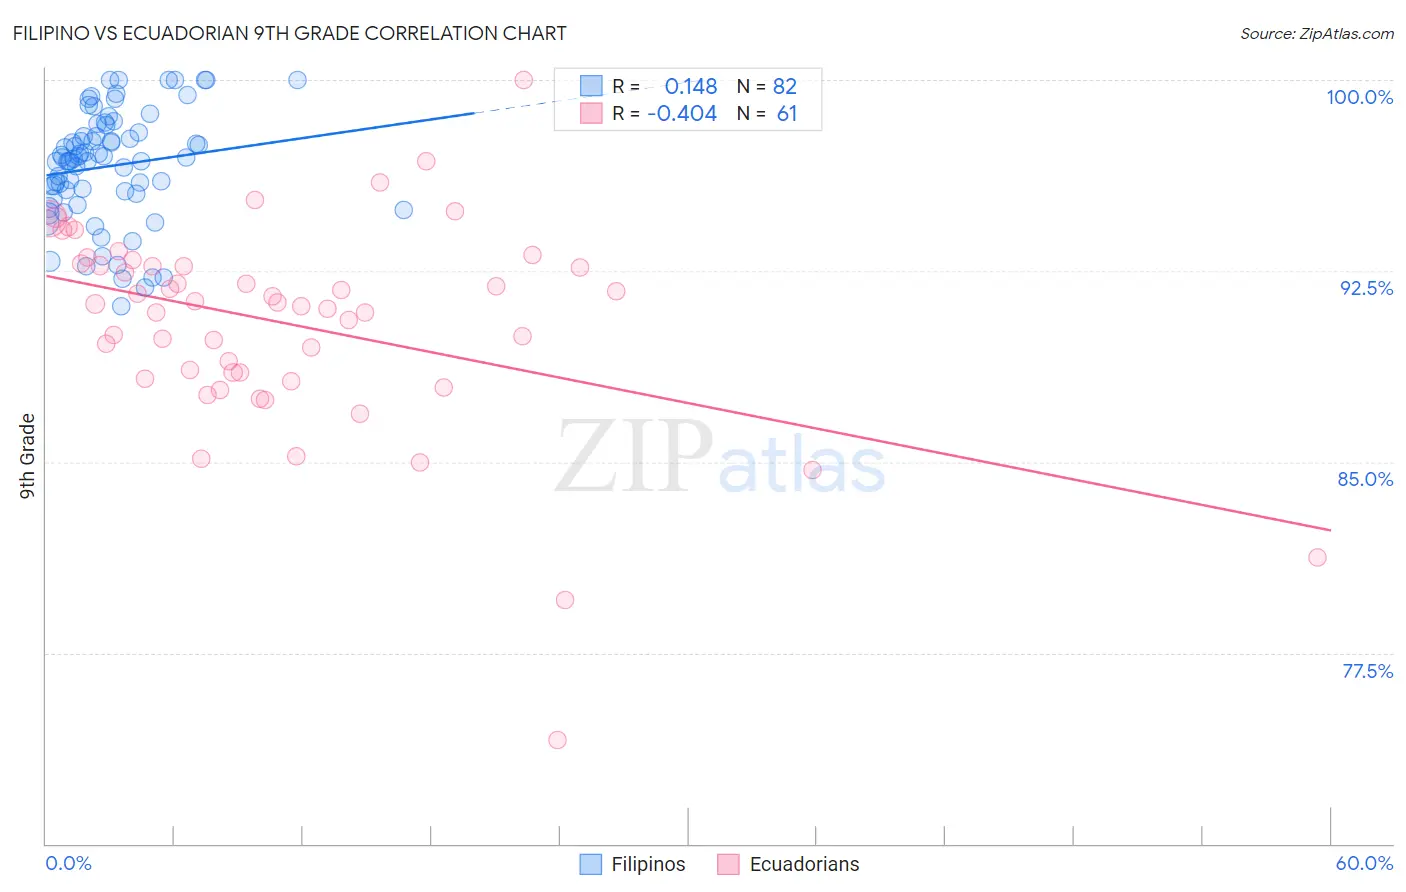
Filipino vs Ecuadorian 9th Grade Correlation Chart
The statistical analysis conducted on geographies consisting of 254,352,171 people shows a poor positive correlation between the proportion of Filipinos and percentage of population with at least 9th grade education in the United States with a correlation coefficient (R) of 0.148 and weighted average of 95.6%. Similarly, the statistical analysis conducted on geographies consisting of 317,864,750 people shows a moderate negative correlation between the proportion of Ecuadorians and percentage of population with at least 9th grade education in the United States with a correlation coefficient (R) of -0.404 and weighted average of 91.9%, a difference of 4.0%.
9th Grade Correlation Summary
| Measurement | Filipino | Ecuadorian |
| Minimum | 91.1% | 74.1% |
| Maximum | 100.0% | 100.0% |
| Range | 8.9% | 25.9% |
| Mean | 96.6% | 90.4% |
| Median | 96.9% | 91.2% |
| Interquartile 25% (IQ1) | 95.5% | 88.4% |
| Interquartile 75% (IQ3) | 97.9% | 92.8% |
| Interquartile Range (IQR) | 2.4% | 4.4% |
| Standard Deviation (Sample) | 2.2% | 4.1% |
| Standard Deviation (Population) | 2.2% | 4.1% |
Similar Demographics by 9th Grade
Demographics Similar to Filipinos by 9th Grade
In terms of 9th grade, the demographic groups most similar to Filipinos are Delaware (95.6%, a difference of 0.0%), American (95.6%, a difference of 0.010%), Immigrants from Japan (95.6%, a difference of 0.020%), Menominee (95.6%, a difference of 0.020%), and Immigrants from Germany (95.6%, a difference of 0.030%).
| Demographics | Rating | Rank | 9th Grade |
| Yugoslavians | 98.9 /100 | #89 | Exceptional 95.7% |
| South Africans | 98.8 /100 | #90 | Exceptional 95.6% |
| Creek | 98.8 /100 | #91 | Exceptional 95.6% |
| Immigrants | Saudi Arabia | 98.8 /100 | #92 | Exceptional 95.6% |
| Immigrants | Germany | 98.7 /100 | #93 | Exceptional 95.6% |
| Immigrants | Latvia | 98.7 /100 | #94 | Exceptional 95.6% |
| Americans | 98.5 /100 | #95 | Exceptional 95.6% |
| Filipinos | 98.5 /100 | #96 | Exceptional 95.6% |
| Delaware | 98.4 /100 | #97 | Exceptional 95.6% |
| Immigrants | Japan | 98.4 /100 | #98 | Exceptional 95.6% |
| Menominee | 98.3 /100 | #99 | Exceptional 95.6% |
| Lebanese | 98.1 /100 | #100 | Exceptional 95.6% |
| Immigrants | Moldova | 97.9 /100 | #101 | Exceptional 95.5% |
| Immigrants | Switzerland | 97.7 /100 | #102 | Exceptional 95.5% |
| Potawatomi | 97.7 /100 | #103 | Exceptional 95.5% |
Demographics Similar to Ecuadorians by 9th Grade
In terms of 9th grade, the demographic groups most similar to Ecuadorians are Nicaraguan (91.9%, a difference of 0.040%), Nepalese (92.0%, a difference of 0.050%), Immigrants from Ecuador (91.8%, a difference of 0.11%), Belizean (91.8%, a difference of 0.13%), and Puerto Rican (91.8%, a difference of 0.14%).
| Demographics | Rating | Rank | 9th Grade |
| Houma | 0.0 /100 | #312 | Tragic 92.3% |
| Vietnamese | 0.0 /100 | #313 | Tragic 92.3% |
| Immigrants | Portugal | 0.0 /100 | #314 | Tragic 92.2% |
| Immigrants | Caribbean | 0.0 /100 | #315 | Tragic 92.2% |
| Cape Verdeans | 0.0 /100 | #316 | Tragic 92.2% |
| Immigrants | Cuba | 0.0 /100 | #317 | Tragic 92.2% |
| Nepalese | 0.0 /100 | #318 | Tragic 92.0% |
| Ecuadorians | 0.0 /100 | #319 | Tragic 91.9% |
| Nicaraguans | 0.0 /100 | #320 | Tragic 91.9% |
| Immigrants | Ecuador | 0.0 /100 | #321 | Tragic 91.8% |
| Belizeans | 0.0 /100 | #322 | Tragic 91.8% |
| Puerto Ricans | 0.0 /100 | #323 | Tragic 91.8% |
| Immigrants | Belize | 0.0 /100 | #324 | Tragic 91.8% |
| Central American Indians | 0.0 /100 | #325 | Tragic 91.5% |
| Immigrants | Armenia | 0.0 /100 | #326 | Tragic 91.4% |