Immigrants from Spain vs Ugandan Master's Degree
COMPARE
Immigrants from Spain
Ugandan
Master's Degree
Master's Degree Comparison
Immigrants from Spain
Ugandans
19.1%
MASTER'S DEGREE
100.0/ 100
METRIC RATING
39th/ 347
METRIC RANK
17.1%
MASTER'S DEGREE
99.0/ 100
METRIC RATING
94th/ 347
METRIC RANK
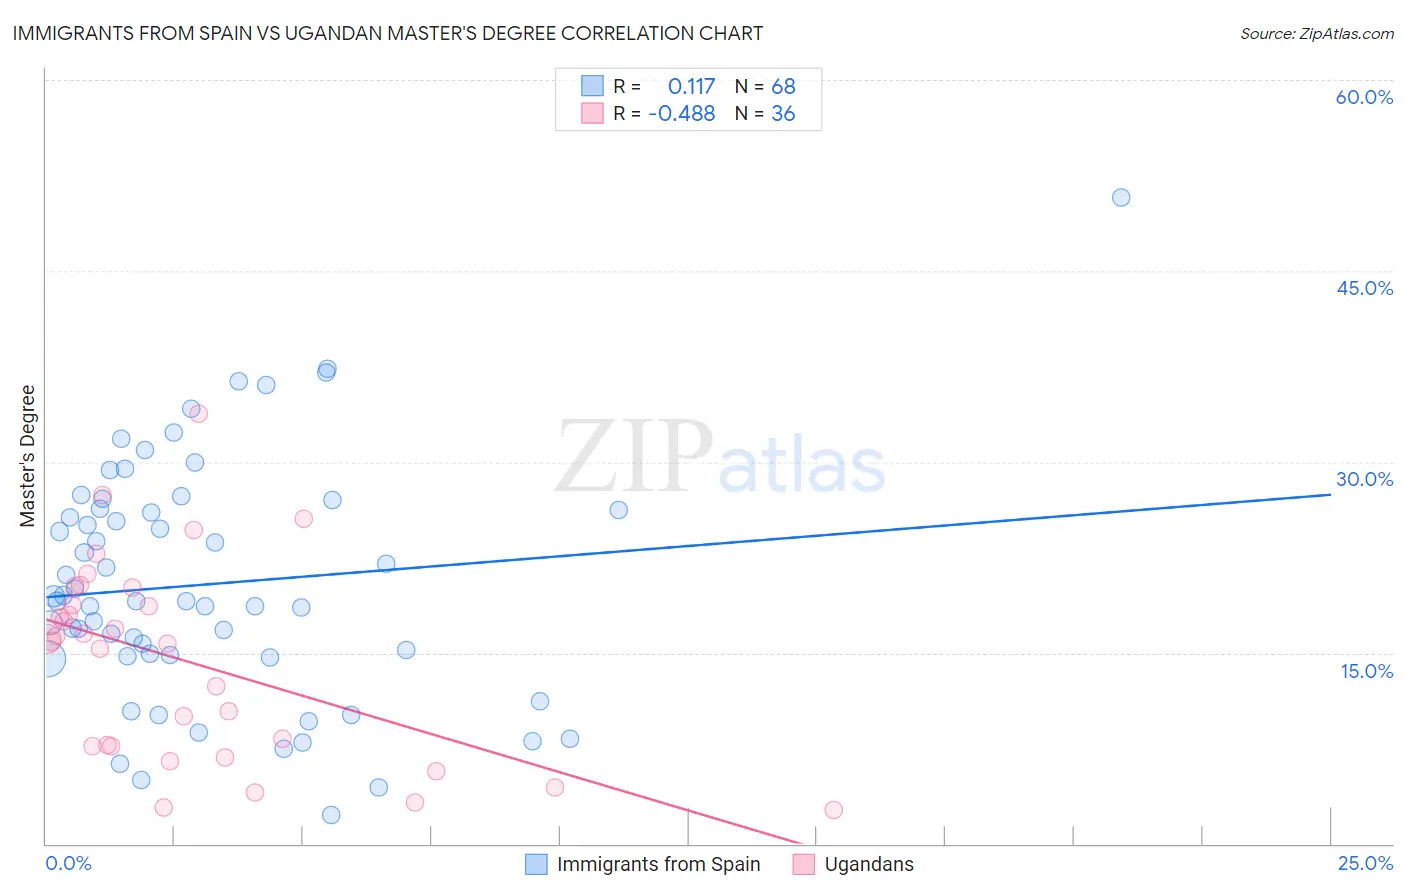
Immigrants from Spain vs Ugandan Master's Degree Correlation Chart
The statistical analysis conducted on geographies consisting of 239,658,516 people shows a poor positive correlation between the proportion of Immigrants from Spain and percentage of population with at least master's degree education in the United States with a correlation coefficient (R) of 0.117 and weighted average of 19.1%. Similarly, the statistical analysis conducted on geographies consisting of 93,998,017 people shows a moderate negative correlation between the proportion of Ugandans and percentage of population with at least master's degree education in the United States with a correlation coefficient (R) of -0.488 and weighted average of 17.1%, a difference of 11.7%.
Master's Degree Correlation Summary
| Measurement | Immigrants from Spain | Ugandan |
| Minimum | 2.2% | 2.7% |
| Maximum | 50.8% | 33.8% |
| Range | 48.5% | 31.1% |
| Mean | 20.4% | 14.4% |
| Median | 19.0% | 16.0% |
| Interquartile 25% (IQ1) | 14.8% | 7.7% |
| Interquartile 75% (IQ3) | 26.3% | 19.4% |
| Interquartile Range (IQR) | 11.5% | 11.8% |
| Standard Deviation (Sample) | 9.3% | 7.7% |
| Standard Deviation (Population) | 9.3% | 7.6% |
Similar Demographics by Master's Degree
Demographics Similar to Immigrants from Spain by Master's Degree
In terms of master's degree, the demographic groups most similar to Immigrants from Spain are Immigrants from Bolivia (19.1%, a difference of 0.13%), Immigrants from Latvia (19.1%, a difference of 0.47%), Bolivian (19.3%, a difference of 0.64%), Immigrants from Saudi Arabia (19.0%, a difference of 0.91%), and Immigrants from Greece (19.0%, a difference of 0.92%).
| Demographics | Rating | Rank | Master's Degree |
| Burmese | 100.0 /100 | #32 | Exceptional 19.7% |
| Russians | 100.0 /100 | #33 | Exceptional 19.5% |
| Immigrants | Denmark | 100.0 /100 | #34 | Exceptional 19.5% |
| Immigrants | Northern Europe | 100.0 /100 | #35 | Exceptional 19.5% |
| Immigrants | Russia | 100.0 /100 | #36 | Exceptional 19.4% |
| Mongolians | 100.0 /100 | #37 | Exceptional 19.4% |
| Bolivians | 100.0 /100 | #38 | Exceptional 19.3% |
| Immigrants | Spain | 100.0 /100 | #39 | Exceptional 19.1% |
| Immigrants | Bolivia | 100.0 /100 | #40 | Exceptional 19.1% |
| Immigrants | Latvia | 100.0 /100 | #41 | Exceptional 19.1% |
| Immigrants | Saudi Arabia | 100.0 /100 | #42 | Exceptional 19.0% |
| Immigrants | Greece | 100.0 /100 | #43 | Exceptional 19.0% |
| Immigrants | Malaysia | 100.0 /100 | #44 | Exceptional 18.9% |
| Immigrants | Belarus | 100.0 /100 | #45 | Exceptional 18.9% |
| Immigrants | Norway | 100.0 /100 | #46 | Exceptional 18.8% |
Demographics Similar to Ugandans by Master's Degree
In terms of master's degree, the demographic groups most similar to Ugandans are Immigrants from Italy (17.2%, a difference of 0.13%), Immigrants from North America (17.2%, a difference of 0.19%), Romanian (17.2%, a difference of 0.24%), Immigrants from Egypt (17.2%, a difference of 0.31%), and Immigrants from Morocco (17.1%, a difference of 0.32%).
| Demographics | Rating | Rank | Master's Degree |
| Maltese | 99.3 /100 | #87 | Exceptional 17.3% |
| Immigrants | Canada | 99.2 /100 | #88 | Exceptional 17.2% |
| Bhutanese | 99.1 /100 | #89 | Exceptional 17.2% |
| Immigrants | Egypt | 99.1 /100 | #90 | Exceptional 17.2% |
| Romanians | 99.1 /100 | #91 | Exceptional 17.2% |
| Immigrants | North America | 99.1 /100 | #92 | Exceptional 17.2% |
| Immigrants | Italy | 99.1 /100 | #93 | Exceptional 17.2% |
| Ugandans | 99.0 /100 | #94 | Exceptional 17.1% |
| Immigrants | Morocco | 98.9 /100 | #95 | Exceptional 17.1% |
| Immigrants | Northern Africa | 98.9 /100 | #96 | Exceptional 17.1% |
| Immigrants | England | 98.8 /100 | #97 | Exceptional 17.0% |
| Immigrants | Ukraine | 98.8 /100 | #98 | Exceptional 17.0% |
| Laotians | 98.8 /100 | #99 | Exceptional 17.0% |
| Albanians | 98.7 /100 | #100 | Exceptional 17.0% |
| Immigrants | Nepal | 98.6 /100 | #101 | Exceptional 17.0% |