Immigrants from Honduras vs Ugandan Master's Degree
COMPARE
Immigrants from Honduras
Ugandan
Master's Degree
Master's Degree Comparison
Immigrants from Honduras
Ugandans
11.8%
MASTER'S DEGREE
0.1/ 100
METRIC RATING
288th/ 347
METRIC RANK
17.1%
MASTER'S DEGREE
99.0/ 100
METRIC RATING
94th/ 347
METRIC RANK
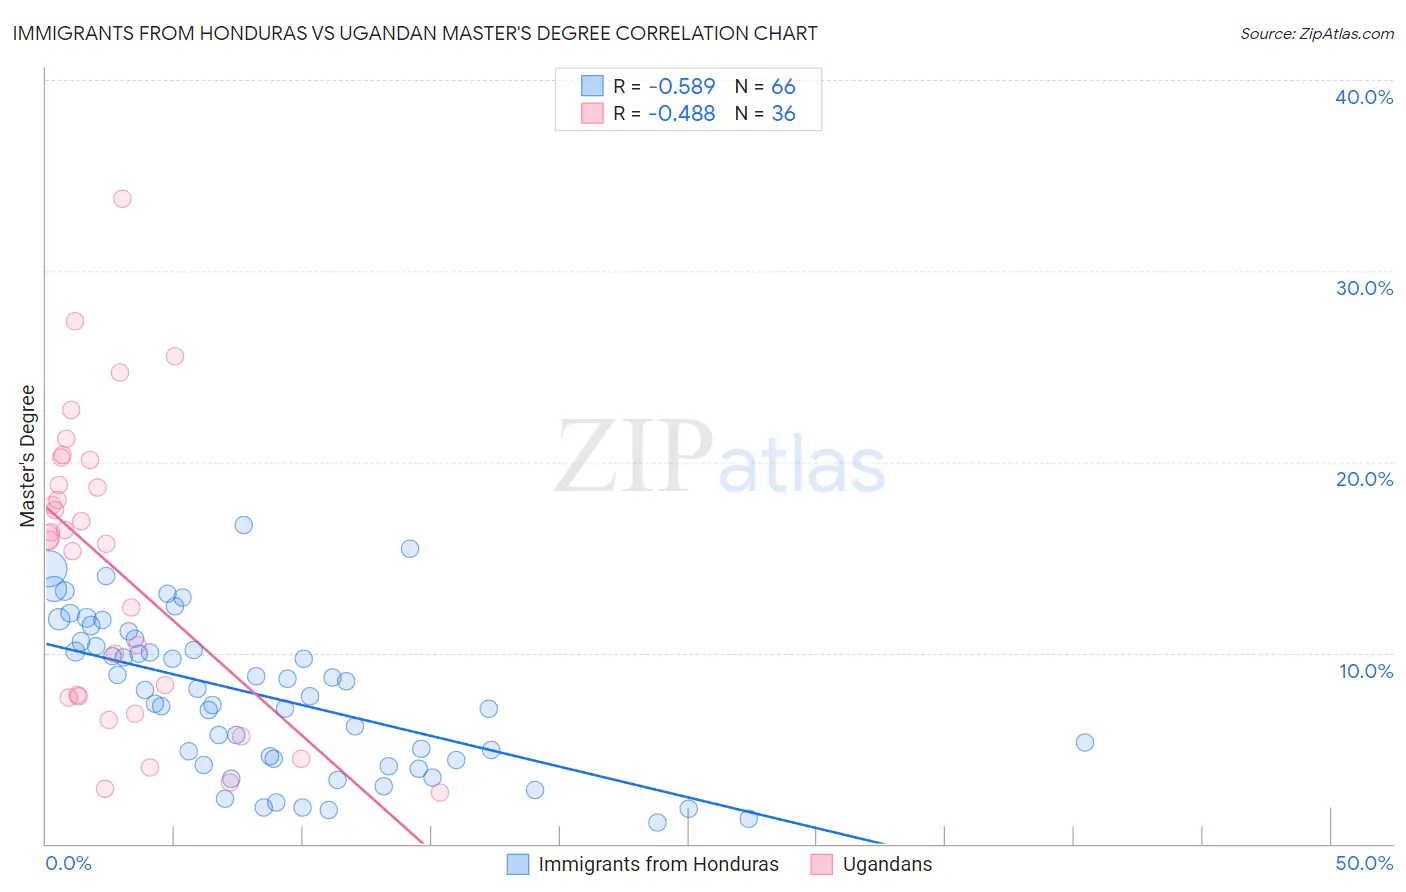
Immigrants from Honduras vs Ugandan Master's Degree Correlation Chart
The statistical analysis conducted on geographies consisting of 322,506,731 people shows a substantial negative correlation between the proportion of Immigrants from Honduras and percentage of population with at least master's degree education in the United States with a correlation coefficient (R) of -0.589 and weighted average of 11.8%. Similarly, the statistical analysis conducted on geographies consisting of 93,998,017 people shows a moderate negative correlation between the proportion of Ugandans and percentage of population with at least master's degree education in the United States with a correlation coefficient (R) of -0.488 and weighted average of 17.1%, a difference of 45.7%.
Master's Degree Correlation Summary
| Measurement | Immigrants from Honduras | Ugandan |
| Minimum | 1.1% | 2.7% |
| Maximum | 16.7% | 33.8% |
| Range | 15.6% | 31.1% |
| Mean | 7.7% | 14.4% |
| Median | 7.9% | 16.0% |
| Interquartile 25% (IQ1) | 4.4% | 7.7% |
| Interquartile 75% (IQ3) | 10.6% | 19.4% |
| Interquartile Range (IQR) | 6.2% | 11.8% |
| Standard Deviation (Sample) | 4.0% | 7.7% |
| Standard Deviation (Population) | 3.9% | 7.6% |
Similar Demographics by Master's Degree
Demographics Similar to Immigrants from Honduras by Master's Degree
In terms of master's degree, the demographic groups most similar to Immigrants from Honduras are Guatemalan (11.7%, a difference of 0.080%), Immigrants from Haiti (11.8%, a difference of 0.17%), Ute (11.7%, a difference of 0.32%), Aleut (11.8%, a difference of 0.36%), and Immigrants from Nicaragua (11.8%, a difference of 0.72%).
| Demographics | Rating | Rank | Master's Degree |
| Malaysians | 0.2 /100 | #281 | Tragic 12.0% |
| Immigrants | El Salvador | 0.2 /100 | #282 | Tragic 12.0% |
| Hondurans | 0.2 /100 | #283 | Tragic 11.9% |
| Ottawa | 0.2 /100 | #284 | Tragic 11.9% |
| Immigrants | Nicaragua | 0.2 /100 | #285 | Tragic 11.8% |
| Aleuts | 0.1 /100 | #286 | Tragic 11.8% |
| Immigrants | Haiti | 0.1 /100 | #287 | Tragic 11.8% |
| Immigrants | Honduras | 0.1 /100 | #288 | Tragic 11.8% |
| Guatemalans | 0.1 /100 | #289 | Tragic 11.7% |
| Ute | 0.1 /100 | #290 | Tragic 11.7% |
| Colville | 0.1 /100 | #291 | Tragic 11.6% |
| Immigrants | Guatemala | 0.1 /100 | #292 | Tragic 11.6% |
| Alaska Natives | 0.1 /100 | #293 | Tragic 11.6% |
| Hawaiians | 0.1 /100 | #294 | Tragic 11.6% |
| Marshallese | 0.1 /100 | #295 | Tragic 11.6% |
Demographics Similar to Ugandans by Master's Degree
In terms of master's degree, the demographic groups most similar to Ugandans are Immigrants from Italy (17.2%, a difference of 0.13%), Immigrants from North America (17.2%, a difference of 0.19%), Romanian (17.2%, a difference of 0.24%), Immigrants from Egypt (17.2%, a difference of 0.31%), and Immigrants from Morocco (17.1%, a difference of 0.32%).
| Demographics | Rating | Rank | Master's Degree |
| Maltese | 99.3 /100 | #87 | Exceptional 17.3% |
| Immigrants | Canada | 99.2 /100 | #88 | Exceptional 17.2% |
| Bhutanese | 99.1 /100 | #89 | Exceptional 17.2% |
| Immigrants | Egypt | 99.1 /100 | #90 | Exceptional 17.2% |
| Romanians | 99.1 /100 | #91 | Exceptional 17.2% |
| Immigrants | North America | 99.1 /100 | #92 | Exceptional 17.2% |
| Immigrants | Italy | 99.1 /100 | #93 | Exceptional 17.2% |
| Ugandans | 99.0 /100 | #94 | Exceptional 17.1% |
| Immigrants | Morocco | 98.9 /100 | #95 | Exceptional 17.1% |
| Immigrants | Northern Africa | 98.9 /100 | #96 | Exceptional 17.1% |
| Immigrants | England | 98.8 /100 | #97 | Exceptional 17.0% |
| Immigrants | Ukraine | 98.8 /100 | #98 | Exceptional 17.0% |
| Laotians | 98.8 /100 | #99 | Exceptional 17.0% |
| Albanians | 98.7 /100 | #100 | Exceptional 17.0% |
| Immigrants | Nepal | 98.6 /100 | #101 | Exceptional 17.0% |