White/Caucasian vs Immigrants from West Indies 11th Grade
COMPARE
White/Caucasian
Immigrants from West Indies
11th Grade
11th Grade Comparison
Whites/Caucasians
Immigrants from West Indies
93.3%
11TH GRADE
97.4/ 100
METRIC RATING
117th/ 347
METRIC RANK
90.4%
11TH GRADE
0.0/ 100
METRIC RATING
286th/ 347
METRIC RANK
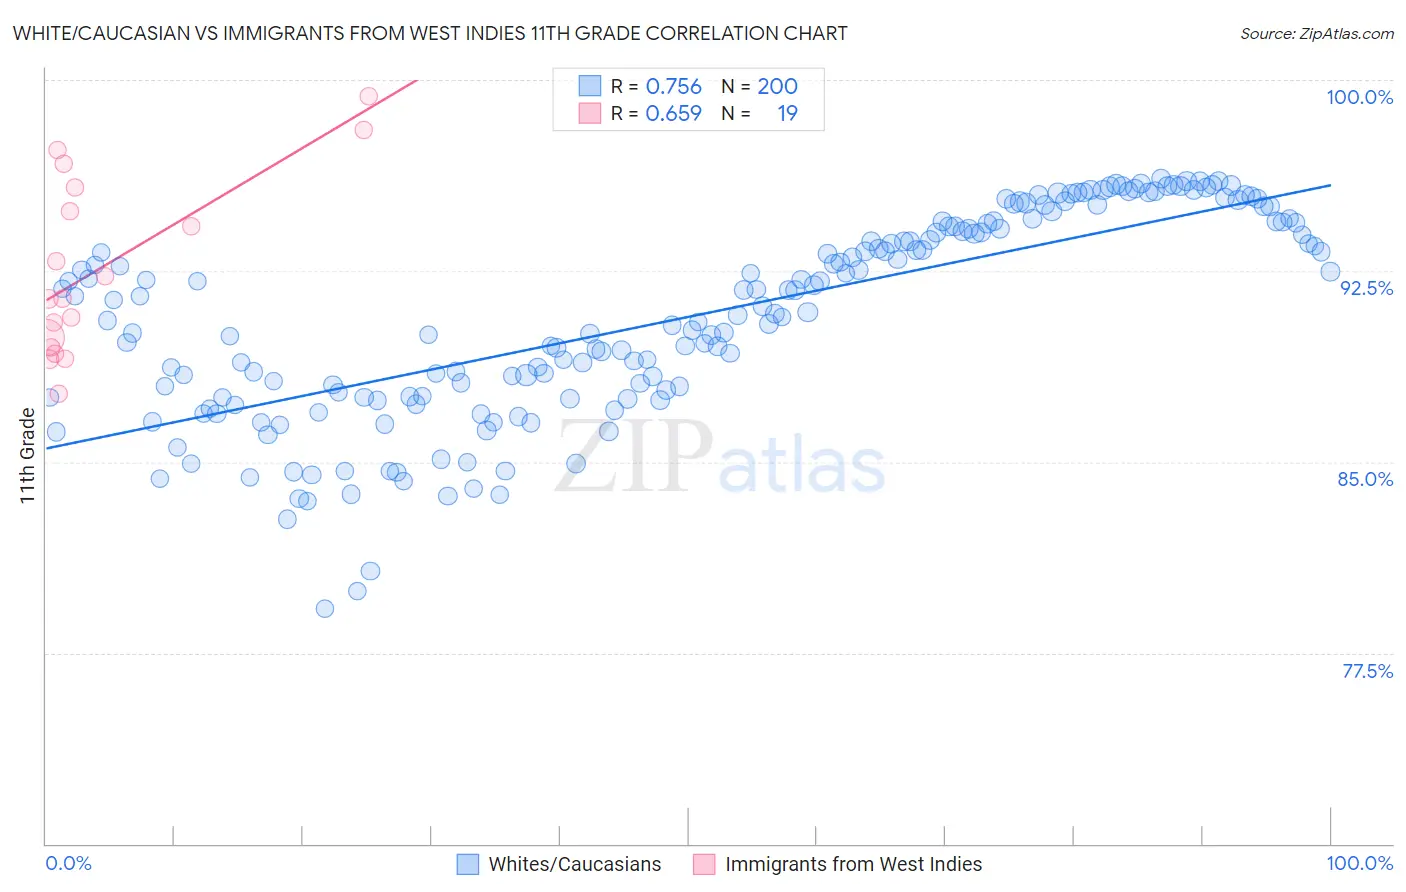
White/Caucasian vs Immigrants from West Indies 11th Grade Correlation Chart
The statistical analysis conducted on geographies consisting of 585,244,244 people shows a strong positive correlation between the proportion of Whites/Caucasians and percentage of population with at least 11th grade education in the United States with a correlation coefficient (R) of 0.756 and weighted average of 93.3%. Similarly, the statistical analysis conducted on geographies consisting of 72,457,514 people shows a significant positive correlation between the proportion of Immigrants from West Indies and percentage of population with at least 11th grade education in the United States with a correlation coefficient (R) of 0.659 and weighted average of 90.4%, a difference of 3.3%.
11th Grade Correlation Summary
| Measurement | White/Caucasian | Immigrants from West Indies |
| Minimum | 79.2% | 87.7% |
| Maximum | 96.1% | 99.4% |
| Range | 16.9% | 11.7% |
| Mean | 90.7% | 92.6% |
| Median | 91.0% | 91.4% |
| Interquartile 25% (IQ1) | 87.6% | 89.5% |
| Interquartile 75% (IQ3) | 94.2% | 95.8% |
| Interquartile Range (IQR) | 6.7% | 6.3% |
| Standard Deviation (Sample) | 4.0% | 3.5% |
| Standard Deviation (Population) | 3.9% | 3.4% |
Similar Demographics by 11th Grade
Demographics Similar to Whites/Caucasians by 11th Grade
In terms of 11th grade, the demographic groups most similar to Whites/Caucasians are Immigrants from Hungary (93.4%, a difference of 0.010%), Palestinian (93.4%, a difference of 0.030%), Jordanian (93.4%, a difference of 0.040%), Immigrants from Korea (93.3%, a difference of 0.040%), and Israeli (93.3%, a difference of 0.040%).
| Demographics | Rating | Rank | 11th Grade |
| Syrians | 98.4 /100 | #110 | Exceptional 93.4% |
| Yugoslavians | 98.1 /100 | #111 | Exceptional 93.4% |
| Immigrants | Germany | 98.0 /100 | #112 | Exceptional 93.4% |
| Immigrants | Zimbabwe | 97.8 /100 | #113 | Exceptional 93.4% |
| Jordanians | 97.8 /100 | #114 | Exceptional 93.4% |
| Palestinians | 97.7 /100 | #115 | Exceptional 93.4% |
| Immigrants | Hungary | 97.5 /100 | #116 | Exceptional 93.4% |
| Whites/Caucasians | 97.4 /100 | #117 | Exceptional 93.3% |
| Immigrants | Korea | 97.0 /100 | #118 | Exceptional 93.3% |
| Israelis | 97.0 /100 | #119 | Exceptional 93.3% |
| Immigrants | Russia | 96.6 /100 | #120 | Exceptional 93.3% |
| German Russians | 96.4 /100 | #121 | Exceptional 93.3% |
| Immigrants | Belarus | 96.3 /100 | #122 | Exceptional 93.3% |
| Immigrants | Greece | 95.9 /100 | #123 | Exceptional 93.2% |
| Immigrants | Eastern Europe | 95.9 /100 | #124 | Exceptional 93.2% |
Demographics Similar to Immigrants from West Indies by 11th Grade
In terms of 11th grade, the demographic groups most similar to Immigrants from West Indies are Apache (90.4%, a difference of 0.010%), Pennsylvania German (90.3%, a difference of 0.030%), Immigrants from Burma/Myanmar (90.4%, a difference of 0.050%), British West Indian (90.3%, a difference of 0.050%), and Indonesian (90.3%, a difference of 0.080%).
| Demographics | Rating | Rank | 11th Grade |
| Barbadians | 0.0 /100 | #279 | Tragic 90.8% |
| Sri Lankans | 0.0 /100 | #280 | Tragic 90.7% |
| Dutch West Indians | 0.0 /100 | #281 | Tragic 90.7% |
| Immigrants | St. Vincent and the Grenadines | 0.0 /100 | #282 | Tragic 90.7% |
| Immigrants | Barbados | 0.0 /100 | #283 | Tragic 90.7% |
| Immigrants | Laos | 0.0 /100 | #284 | Tragic 90.5% |
| Immigrants | Burma/Myanmar | 0.0 /100 | #285 | Tragic 90.4% |
| Immigrants | West Indies | 0.0 /100 | #286 | Tragic 90.4% |
| Apache | 0.0 /100 | #287 | Tragic 90.4% |
| Pennsylvania Germans | 0.0 /100 | #288 | Tragic 90.3% |
| British West Indians | 0.0 /100 | #289 | Tragic 90.3% |
| Indonesians | 0.0 /100 | #290 | Tragic 90.3% |
| Haitians | 0.0 /100 | #291 | Tragic 90.3% |
| Cubans | 0.0 /100 | #292 | Tragic 90.2% |
| Natives/Alaskans | 0.0 /100 | #293 | Tragic 90.2% |